skimage.feature#
特征检测和提取,例如纹理分析、角点等。
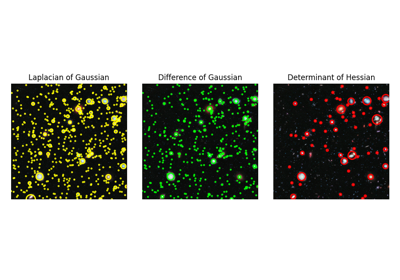
在给定的灰度图像中查找斑点。 |
|
在给定的灰度图像中查找斑点。 |
|
在给定的灰度图像中查找斑点。 |
|
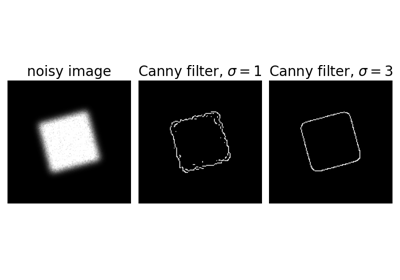
使用 Canny 算法对图像进行边缘滤波。 |
|
为给定的图像提取 FAST 角点。 |
|
计算 Foerstner 角点度量响应图像。 |
|
计算 Harris 角点度量响应图像。 |
|
计算 Kitchen 和 Rosenfeld 角点度量响应图像。 |
|
计算 Moravec 角点度量响应图像。 |
|
计算角点的方向。 |
|
在角点度量响应图像中查找峰值。 |
|
计算 Shi-Tomasi (Kanade-Tomasi) 角点度量响应图像。 |
|
确定角点的亚像素位置。 |
|
为给定的图像密集提取 DAISY 特征描述符。 |
|
Haar 样特征的可视化。 |
|
多块局部二值模式可视化。 |
|
计算给定的一些描述符/向量和相关的估计 GMM 的 Fisher 向量。 |
|
计算灰度共生矩阵。 |
|
计算 GLCM 的纹理属性。 |
|
计算积分图像的感兴趣区域 (ROI) 的 Haar 样特征。 |
|
计算 Haar 样特征的坐标。 |
|
计算 Hessian 矩阵。 |
|
计算图像上的近似 Hessian 行列式。 |
|
计算 Hessian 矩阵的特征值。 |
|
提取给定图像的定向梯度直方图 (HOG)。 |
|
给定一组描述符和模式数量(即高斯分布),估计高斯混合模型 (GMM)。 |
|
计算图像的局部二值模式 (LBP)。 |
|
描述符的暴力匹配。 |
|
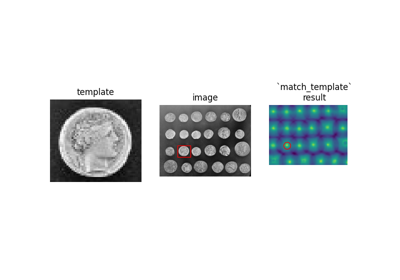
使用归一化相关性将模板匹配到 2D 或 3D 图像。 |
|
多块局部二值模式 (MB-LBP)。 |
|
单通道或多通道 nd 图像的局部特征。 |
|
在图像中查找峰值作为坐标列表。 |
|
绘制两个图像之间匹配的特征。 |
|
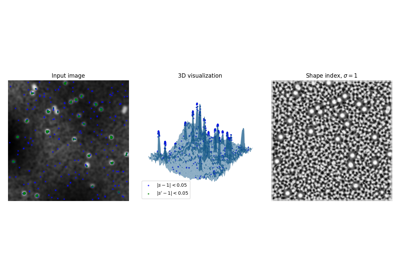
计算形状索引。 |
|
使用平方差之和计算结构张量。 |
|
计算结构张量的特征值。 |
|
BRIEF 二进制描述符提取器。 |
|
CENSURE 关键点检测器。 |
|
用于对象检测的分类器级联的类。 |
|
定向 FAST 和旋转 BRIEF 特征检测器和二进制描述符提取器。 |
|
SIFT 特征检测和描述符提取。 |
- skimage.feature.blob_dog(image, min_sigma=1, max_sigma=50, sigma_ratio=1.6, threshold=0.5, overlap=0.5, *, threshold_rel=None, exclude_border=False)[源代码]#
在给定的灰度图像中查找斑点。
使用高斯差分 (DoG) 方法 [1], [2] 查找斑点。对于找到的每个斑点,该方法返回其坐标和检测到该斑点的高斯核的标准差。
- 参数:
- imagendarray
输入灰度图像,假设斑点在深色背景上是浅色的(黑色背景上的白色)。
- min_sigma标量或标量序列,可选
高斯核的最小标准差。保持此值较低以检测较小的斑点。高斯滤波器的标准差对于每个轴都以序列形式给出,或者以单个数字给出,在这种情况下,它对于所有轴都相等。
- max_sigma标量或标量序列,可选
高斯核的最大标准差。保持此值较高以检测较大的斑点。高斯滤波器的标准差对于每个轴都以序列形式给出,或者以单个数字给出,在这种情况下,它对于所有轴都相等。
- sigma_ratio浮点数,可选
用于计算高斯差分的高斯核的标准差之间的比率
- threshold浮点数或 None,可选
尺度空间最大值的绝对下限。小于
threshold的局部最大值将被忽略。减少此值以检测强度较低的斑点。如果还指定了threshold_rel,则将使用较大的阈值。如果为 None,则改为使用threshold_rel。- overlap浮点数,可选
介于 0 和 1 之间的值。如果两个斑点的面积重叠的比例大于
threshold,则较小的斑点将被消除。- threshold_rel浮点数或 None,可选
峰值的最小强度,计算为
max(dog_space) * threshold_rel,其中dog_space指的是内部计算的高斯差分 (DoG) 图像堆栈。该值应介于 0 和 1 之间。如果为 None,则改为使用threshold。- exclude_border整数元组、整数或 False,可选
如果为整数元组,则元组的长度必须与输入数组的维度匹配。元组的每个元素将排除沿该维度的图像边界的
exclude_border像素内的峰值。如果为非零整数,则exclude_border排除图像边界的exclude_border像素内的峰值。如果为零或 False,则识别峰值,而无论它们与边界的距离如何。
- 返回:
- A(n, image.ndim + sigma) ndarray
一个 2d 数组,其中每行表示 2D 图像的 2 个坐标值,或 3D 图像的 3 个坐标值,以及使用的 sigma 值。当传递单个 sigma 时,输出为:
(r, c, sigma)或(p, r, c, sigma),其中(r, c)或(p, r, c)是斑点的坐标,sigma是检测到斑点的高斯核的标准差。当使用各向异性高斯函数时(每个维度的 sigma),将返回每个维度检测到的 sigma。
注释
对于 2-D 图像,每个斑点的半径约为 \(\sqrt{2}\sigma\),对于 3-D 图像,约为 \(\sqrt{3}\sigma\)。
参考文献
[2]Lowe, D. G. “Distinctive Image Features from Scale-Invariant Keypoints.” International Journal of Computer Vision 60, 91–110 (2004). https://www.cs.ubc.ca/~lowe/papers/ijcv04.pdf DOI:10.1023/B:VISI.0000029664.99615.94
示例
>>> from skimage import data, feature
>>> coins = data.coins()
>>> feature.blob_dog(coins, threshold=.05, min_sigma=10, max_sigma=40)
array([[128., 155.,  10.],
       [198., 155.,  10.],
       [124., 338.,  10.],
       [127., 102.,  10.],
       [193., 281.,  10.],
       [126., 208.,  10.],
       [267., 115.,  10.],
       [197., 102.,  10.],
       [198., 215.,  10.],
       [123., 279.,  10.],
       [126.,  46.,  10.],
       [259., 247.,  10.],
       [196.,  43.,  10.],
       [ 54., 276.,  10.],
       [267., 358.,  10.],
       [ 58., 100.,  10.],
       [259., 305.,  10.],
       [185., 347.,  16.],
       [261., 174.,  16.],
       [ 46., 336.,  16.],
       [ 54., 217.,  10.],
       [ 55., 157.,  10.],
       [ 57.,  41.,  10.],
       [260.,  47.,  16.]])
- skimage.feature.blob_doh(image, min_sigma=1, max_sigma=30, num_sigma=10, threshold=0.01, overlap=0.5, log_scale=False, *, threshold_rel=None)[源代码]#
在给定的灰度图像中查找斑点。
使用 Hessian 行列式方法 [1] 查找斑点。对于找到的每个斑点,该方法返回其坐标和用于 Hessian 矩阵的高斯核的标准差,该矩阵的行列式检测到该斑点。Hessian 行列式使用 [2] 进行近似。
- 参数:
- image2D ndarray
输入灰度图像。斑点可以是浅色背景上的深色,也可以是相反的情况。
- min_sigma浮点数,可选
用于计算 Hessian 矩阵的高斯核的最小标准差。保持此值较低以检测较小的斑点。
- max_sigma浮点数,可选
用于计算 Hessian 矩阵的高斯核的最大标准差。保持此值较高可以检测到更大的斑点。
- num_sigmaint,可选
在
min_sigma和max_sigma之间要考虑的标准差中间值的数量。- threshold浮点数或 None,可选
尺度空间最大值的绝对下限。小于
threshold的局部最大值将被忽略。减少此值以检测强度较低的斑点。如果还指定了threshold_rel,则将使用较大的阈值。如果为 None,则改为使用threshold_rel。- overlap浮点数,可选
介于 0 和 1 之间的值。如果两个斑点的面积重叠的比例大于
threshold,则较小的斑点将被消除。- log_scalebool,可选
如果设置,则使用以
10为底的对数刻度来插值标准差的中间值。否则,使用线性插值。- threshold_rel浮点数或 None,可选
峰值的最小强度,计算公式为
max(doh_space) * threshold_rel,其中doh_space指的是内部计算的 Hessian 行列式 (DoH) 图像堆栈。此值应介于 0 和 1 之间。如果为 None,则改用threshold。
- 返回:
- A(n, 3) ndarray
一个二维数组,每行表示 3 个值,
(y,x,sigma),其中(y,x)是斑点的坐标,sigma是检测到斑点的 Hessian 矩阵的高斯核的标准差。
注释
每个斑点的半径大约为
sigma。Hessian 行列式的计算与标准差无关。因此,检测更大的斑点不会花费更多时间。在blob_dog()和blob_log()方法中,计算较大sigma的高斯函数会花费更多时间。缺点是,由于 Hessian 行列式近似中使用了盒式滤波器,因此此方法不能用于检测半径小于3px的斑点。参考文献
[2]Herbert Bay, Andreas Ess, Tinne Tuytelaars, Luc Van Gool, “SURF: Speeded Up Robust Features” ftp://ftp.vision.ee.ethz.ch/publications/articles/eth_biwi_00517.pdf
示例
>>> from skimage import data, feature
>>> img = data.coins()
>>> feature.blob_doh(img)
array([[197.        , 153.        ,  20.33333333],
       [124.        , 336.        ,  20.33333333],
       [126.        , 153.        ,  20.33333333],
       [195.        , 100.        ,  23.55555556],
       [192.        , 212.        ,  23.55555556],
       [121.        , 271.        ,  30.        ],
       [126.        , 101.        ,  20.33333333],
       [193.        , 275.        ,  23.55555556],
       [123.        , 205.        ,  20.33333333],
       [270.        , 363.        ,  30.        ],
       [265.        , 113.        ,  23.55555556],
       [262.        , 243.        ,  23.55555556],
       [185.        , 348.        ,  30.        ],
       [156.        , 302.        ,  30.        ],
       [123.        ,  44.        ,  23.55555556],
       [260.        , 173.        ,  30.        ],
       [197.        ,  44.        ,  20.33333333]])
- skimage.feature.blob_log(image, min_sigma=1, max_sigma=50, num_sigma=10, threshold=0.2, overlap=0.5, log_scale=False, *, threshold_rel=None, exclude_border=False)[source]#
在给定的灰度图像中查找斑点。
使用高斯拉普拉斯算子 (LoG) 方法 [1] 查找斑点。对于找到的每个斑点,该方法返回其坐标和检测到该斑点的高斯核的标准差。
- 参数:
- imagendarray
输入灰度图像,假设斑点在深色背景上是浅色的(黑色背景上的白色)。
- min_sigma标量或标量序列,可选
高斯核的最小标准差。保持此值较低以检测较小的斑点。高斯滤波器的标准差以序列或单个数字的形式给出每个轴,在单个数字的情况下,所有轴都相等。
- max_sigma标量或标量序列,可选
高斯核的最大标准差。保持此值较高以检测较大的斑点。高斯滤波器的标准差对于每个轴都以序列形式给出,或者以单个数字给出,在这种情况下,它对于所有轴都相等。
- num_sigmaint,可选
在
min_sigma和max_sigma之间要考虑的标准差中间值的数量。- threshold浮点数或 None,可选
尺度空间最大值的绝对下限。小于
threshold的局部最大值将被忽略。减少此值以检测强度较低的斑点。如果还指定了threshold_rel,则将使用较大的阈值。如果为 None,则改为使用threshold_rel。- overlap浮点数,可选
介于 0 和 1 之间的值。如果两个斑点的面积重叠的比例大于
threshold,则较小的斑点将被消除。- log_scalebool,可选
如果设置,则使用以
10为底的对数刻度来插值标准差的中间值。否则,使用线性插值。- threshold_rel浮点数或 None,可选
峰值的最小强度,计算公式为
max(log_space) * threshold_rel,其中log_space指的是内部计算的高斯拉普拉斯算子 (LoG) 图像堆栈。此值应介于 0 和 1 之间。如果为 None,则改用threshold。- exclude_border整数元组、整数或 False,可选
如果为整数元组,则元组的长度必须与输入数组的维度匹配。元组的每个元素将排除沿该维度的图像边界的
exclude_border像素内的峰值。如果为非零整数,则exclude_border排除图像边界的exclude_border像素内的峰值。如果为零或 False,则识别峰值,而无论它们与边界的距离如何。
- 返回:
- A(n, image.ndim + sigma) ndarray
一个 2d 数组,其中每行表示 2D 图像的 2 个坐标值,或 3D 图像的 3 个坐标值,以及使用的 sigma 值。当传递单个 sigma 时,输出为:
(r, c, sigma)或(p, r, c, sigma),其中(r, c)或(p, r, c)是斑点的坐标,sigma是检测到斑点的高斯核的标准差。当使用各向异性高斯函数时(每个维度的 sigma),将返回每个维度检测到的 sigma。
注释
对于 2-D 图像,每个斑点的半径约为 \(\sqrt{2}\sigma\),对于 3-D 图像,约为 \(\sqrt{3}\sigma\)。
参考文献
示例
>>> from skimage import data, feature, exposure
>>> img = data.coins()
>>> img = exposure.equalize_hist(img)  # improves detection
>>> feature.blob_log(img, threshold = .3)
array([[124.        , 336.        ,  11.88888889],
       [198.        , 155.        ,  11.88888889],
       [194.        , 213.        ,  17.33333333],
       [121.        , 272.        ,  17.33333333],
       [263.        , 244.        ,  17.33333333],
       [194.        , 276.        ,  17.33333333],
       [266.        , 115.        ,  11.88888889],
       [128.        , 154.        ,  11.88888889],
       [260.        , 174.        ,  17.33333333],
       [198.        , 103.        ,  11.88888889],
       [126.        , 208.        ,  11.88888889],
       [127.        , 102.        ,  11.88888889],
       [263.        , 302.        ,  17.33333333],
       [197.        ,  44.        ,  11.88888889],
       [185.        , 344.        ,  17.33333333],
       [126.        ,  46.        ,  11.88888889],
       [113.        , 323.        ,   1.        ]])
- skimage.feature.canny(image, sigma=1.0, low_threshold=None, high_threshold=None, mask=None, use_quantiles=False, *, mode='constant', cval=0.0)[source]#
使用 Canny 算法对图像进行边缘滤波。
- 参数:
- image二维数组
用于检测边缘的灰度输入图像;可以是任何 dtype。
- sigmafloat,可选
高斯滤波器的标准差。
- low_thresholdfloat,可选
滞后阈值(连接边缘)的下限。如果为 None,则 low_threshold 设置为 dtype 最大值的 10%。
- high_thresholdfloat,可选
滞后阈值(连接边缘)的上限。如果为 None,则 high_threshold 设置为 dtype 最大值的 20%。
- maskarray,dtype=bool,可选
用于限制 Canny 在特定区域应用的掩码。
- use_quantilesbool,可选
如果
True,则将 low_threshold 和 high_threshold 视为边缘强度图像的分位数,而不是绝对边缘强度值。如果True,则阈值必须在 [0, 1] 范围内。- modestr,{‘reflect’,‘constant’,‘nearest’,‘mirror’,‘wrap’}
mode参数确定在高斯滤波期间如何处理数组边界,其中cval是模式等于 'constant' 时使用的值。- cvalfloat,可选
如果
mode为 'constant',则填充输入边缘过去的值。
- 返回:
- output二维数组(图像)
二进制边缘图。
注释
算法的步骤如下
使用宽度为
sigma的高斯函数平滑图像。应用水平和垂直 Sobel 算子以获取图像内的梯度。边缘强度是梯度的范数。
将潜在边缘细化为 1 像素宽的曲线。首先,找到每个点边缘的法线。这是通过查看 X-Sobel 和 Y-Sobel 的符号和相对大小,将点排序到 4 个类别中:水平、垂直、对角线和反对角线。然后,在法线和反向方向上查看,以查看这些方向中的值是否大于所讨论的点。使用插值来获得点的混合,而不是选择最接近法线的点。
执行滞后阈值处理:首先将所有高于高阈值的点标记为边缘。然后递归地将任何高于低阈值且与标记点 8 连接的点标记为边缘。
参考文献
[1]Canny, J., A Computational Approach To Edge Detection, IEEE Trans. Pattern Analysis and Machine Intelligence, 8:679-714, 1986 DOI:10.1109/TPAMI.1986.4767851
[2]William Green 的 Canny 教程 https://en.wikipedia.org/wiki/Canny_edge_detector
示例
>>> from skimage import feature
>>> rng = np.random.default_rng()
>>> # Generate noisy image of a square
>>> im = np.zeros((256, 256))
>>> im[64:-64, 64:-64] = 1
>>> im += 0.2 * rng.random(im.shape)
>>> # First trial with the Canny filter, with the default smoothing
>>> edges1 = feature.canny(im)
>>> # Increase the smoothing for better results
>>> edges2 = feature.canny(im, sigma=3)
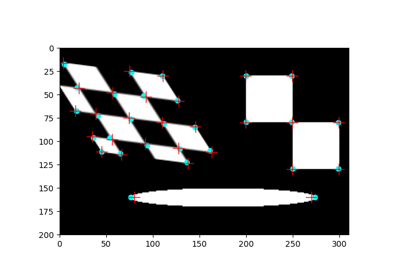
- skimage.feature.corner_fast(image, n=12, threshold=0.15)[source]#
为给定的图像提取 FAST 角点。
- 参数:
- image(M, N) ndarray
输入图像。
- nint,可选
圆上 16 个像素中,相对于测试像素,应全部更亮或更暗的连续像素的最小数量。如果
Ic < Ip - threshold,则圆上的点 c 相对于测试像素 p 更暗,如果Ic > Ip + threshold,则更亮。也代表FAST-n角点检测器中的 n。- thresholdfloat,可选
用于确定圆上的像素相对于测试像素是更亮、更暗还是相似的阈值。当需要更多角点时,减小阈值,反之亦然。
- 返回:
- responsendarray
FAST 角点响应图像。
参考文献
[1]Rosten, E., & Drummond, T. (2006, 5月). 用于高速角点检测的机器学习。在欧洲计算机视觉会议论文集 (页 430-443). 柏林,海德堡:施普林格出版社。DOI:10.1007/11744023_34 http://www.edwardrosten.com/work/rosten_2006_machine.pdf
[2]维基百科,“加速分割测试的特征”,https://en.wikipedia.org/wiki/Features_from_accelerated_segment_test
示例
>>> from skimage.feature import corner_fast, corner_peaks
>>> square = np.zeros((12, 12))
>>> square[3:9, 3:9] = 1
>>> square.astype(int)
array([[0, 0, 0, 0, 0, 0, 0, 0, 0, 0, 0, 0],
       [0, 0, 0, 0, 0, 0, 0, 0, 0, 0, 0, 0],
       [0, 0, 0, 0, 0, 0, 0, 0, 0, 0, 0, 0],
       [0, 0, 0, 1, 1, 1, 1, 1, 1, 0, 0, 0],
       [0, 0, 0, 1, 1, 1, 1, 1, 1, 0, 0, 0],
       [0, 0, 0, 1, 1, 1, 1, 1, 1, 0, 0, 0],
       [0, 0, 0, 1, 1, 1, 1, 1, 1, 0, 0, 0],
       [0, 0, 0, 1, 1, 1, 1, 1, 1, 0, 0, 0],
       [0, 0, 0, 1, 1, 1, 1, 1, 1, 0, 0, 0],
       [0, 0, 0, 0, 0, 0, 0, 0, 0, 0, 0, 0],
       [0, 0, 0, 0, 0, 0, 0, 0, 0, 0, 0, 0],
       [0, 0, 0, 0, 0, 0, 0, 0, 0, 0, 0, 0]])
>>> corner_peaks(corner_fast(square, 9), min_distance=1)
array([[3, 3],
       [3, 8],
       [8, 3],
       [8, 8]])
- skimage.feature.corner_foerstner(image, sigma=1)[source]#
计算 Foerstner 角点度量响应图像。
此角点检测器使用自相关矩阵 A 的信息
A = [(imx**2)   (imx*imy)] = [Axx Axy]
    [(imx*imy)   (imy**2)]   [Axy Ayy]
其中 imx 和 imy 是使用高斯滤波器平均的一阶导数。然后将角点度量定义为
w = det(A) / trace(A)           (size of error ellipse)
q = 4 * det(A) / trace(A)**2    (roundness of error ellipse)
- 参数:
- image(M, N) ndarray
输入图像。
- sigmafloat,可选
用于高斯核的标准偏差,它用作自相关矩阵的加权函数。
- 返回:
- wndarray
误差椭圆大小。
- qndarray
误差椭圆的圆度。
参考文献
[1]Förstner, W., & Gülch, E. (1987, 6月)。 用于检测和精确定位不同点、角点和圆形特征中心的快速算子。在摄影测量数据快速处理的 ISPRS 跨委员会会议论文集 (页 281-305)。https://cseweb.ucsd.edu/classes/sp02/cse252/foerstner/foerstner.pdf
示例
>>> from skimage.feature import corner_foerstner, corner_peaks
>>> square = np.zeros([10, 10])
>>> square[2:8, 2:8] = 1
>>> square.astype(int)
array([[0, 0, 0, 0, 0, 0, 0, 0, 0, 0],
       [0, 0, 0, 0, 0, 0, 0, 0, 0, 0],
       [0, 0, 1, 1, 1, 1, 1, 1, 0, 0],
       [0, 0, 1, 1, 1, 1, 1, 1, 0, 0],
       [0, 0, 1, 1, 1, 1, 1, 1, 0, 0],
       [0, 0, 1, 1, 1, 1, 1, 1, 0, 0],
       [0, 0, 1, 1, 1, 1, 1, 1, 0, 0],
       [0, 0, 1, 1, 1, 1, 1, 1, 0, 0],
       [0, 0, 0, 0, 0, 0, 0, 0, 0, 0],
       [0, 0, 0, 0, 0, 0, 0, 0, 0, 0]])
>>> w, q = corner_foerstner(square)
>>> accuracy_thresh = 0.5
>>> roundness_thresh = 0.3
>>> foerstner = (q > roundness_thresh) * (w > accuracy_thresh) * w
>>> corner_peaks(foerstner, min_distance=1)
array([[2, 2],
       [2, 7],
       [7, 2],
       [7, 7]])
- skimage.feature.corner_harris(image, method='k', k=0.05, eps=1e-06, sigma=1)[source]#
计算 Harris 角点度量响应图像。
此角点检测器使用自相关矩阵 A 的信息
A = [(imx**2)   (imx*imy)] = [Axx Axy]
    [(imx*imy)   (imy**2)]   [Axy Ayy]
其中 imx 和 imy 是使用高斯滤波器平均的一阶导数。然后将角点度量定义为
det(A) - k * trace(A)**2
或者
2 * det(A) / (trace(A) + eps)
- 参数:
- image(M, N) ndarray
输入图像。
- method{‘k’, ‘eps’}, 可选
从自相关矩阵计算响应图像的方法。
- kfloat, 可选
用于将角点与边缘分开的灵敏度因子,通常在
[0, 0.2]范围内。k 值越小,检测到的锐角就越多。- epsfloat, 可选
归一化因子(Noble 的角点度量)。
- sigmafloat,可选
用于高斯核的标准偏差,它用作自相关矩阵的加权函数。
- 返回:
- responsendarray
Harris 响应图像。
参考文献
示例
>>> from skimage.feature import corner_harris, corner_peaks
>>> square = np.zeros([10, 10])
>>> square[2:8, 2:8] = 1
>>> square.astype(int)
array([[0, 0, 0, 0, 0, 0, 0, 0, 0, 0],
       [0, 0, 0, 0, 0, 0, 0, 0, 0, 0],
       [0, 0, 1, 1, 1, 1, 1, 1, 0, 0],
       [0, 0, 1, 1, 1, 1, 1, 1, 0, 0],
       [0, 0, 1, 1, 1, 1, 1, 1, 0, 0],
       [0, 0, 1, 1, 1, 1, 1, 1, 0, 0],
       [0, 0, 1, 1, 1, 1, 1, 1, 0, 0],
       [0, 0, 1, 1, 1, 1, 1, 1, 0, 0],
       [0, 0, 0, 0, 0, 0, 0, 0, 0, 0],
       [0, 0, 0, 0, 0, 0, 0, 0, 0, 0]])
>>> corner_peaks(corner_harris(square), min_distance=1)
array([[2, 2],
       [2, 7],
       [7, 2],
       [7, 7]])
- skimage.feature.corner_kitchen_rosenfeld(image, mode='constant', cval=0)[source]#
计算 Kitchen 和 Rosenfeld 角点度量响应图像。
角点度量计算如下
(imxx * imy**2 + imyy * imx**2 - 2 * imxy * imx * imy)
    / (imx**2 + imy**2)
其中 imx 和 imy 是第一导数,而 imxx、imxy、imyy 是第二导数。
- 参数:
- image(M, N) ndarray
输入图像。
- mode{‘constant’, ‘reflect’, ‘wrap’, ‘nearest’, ‘mirror’}, 可选
如何处理图像边界之外的值。
- cvalfloat,可选
与模式“constant”结合使用时,图像边界之外的值。
- 返回:
- responsendarray
Kitchen 和 Rosenfeld 响应图像。
参考文献
[1]Kitchen, L., & Rosenfeld, A. (1982)。灰度级角点检测。模式识别快报, 1(2), 95-102。DOI:10.1016/0167-8655(82)90020-4
- skimage.feature.corner_moravec(image, window_size=1)[source]#
计算 Moravec 角点度量响应图像。
这是最简单的角点检测器之一,速度相对较快,但存在一些局限性(例如,不具有旋转不变性)。
- 参数:
- image(M, N) ndarray
输入图像。
- window_sizeint, 可选
窗口大小。
- 返回:
- responsendarray
Moravec 响应图像。
参考文献
示例
>>> from skimage.feature import corner_moravec
>>> square = np.zeros([7, 7])
>>> square[3, 3] = 1
>>> square.astype(int)
array([[0, 0, 0, 0, 0, 0, 0],
       [0, 0, 0, 0, 0, 0, 0],
       [0, 0, 0, 0, 0, 0, 0],
       [0, 0, 0, 1, 0, 0, 0],
       [0, 0, 0, 0, 0, 0, 0],
       [0, 0, 0, 0, 0, 0, 0],
       [0, 0, 0, 0, 0, 0, 0]])
>>> corner_moravec(square).astype(int)
array([[0, 0, 0, 0, 0, 0, 0],
       [0, 0, 0, 0, 0, 0, 0],
       [0, 0, 1, 1, 1, 0, 0],
       [0, 0, 1, 2, 1, 0, 0],
       [0, 0, 1, 1, 1, 0, 0],
       [0, 0, 0, 0, 0, 0, 0],
       [0, 0, 0, 0, 0, 0, 0]])
- skimage.feature.corner_orientations(image, corners, mask)[source]#
计算角点的方向。
角点的方向是使用一阶中心矩计算的,即质心方法。角点方向是从角点坐标到使用一阶中心矩计算的角点周围局部邻域中强度质心的向量的角度。
- 参数:
- image(M, N) 数组
输入灰度图像。
- corners(K, 2) 数组
角点坐标为
(row, col)。- mask2D 数组
定义用于计算中心矩的角点局部邻域的掩码。
- 返回:
- orientations(K, 1) 数组
角点的方向,范围为 [-pi, pi]。
参考文献
[1]Ethan Rublee、Vincent Rabaud、Kurt Konolige 和 Gary Bradski,“ORB : SIFT 和 SURF 的有效替代方案” http://www.vision.cs.chubu.ac.jp/CV-R/pdf/Rublee_iccv2011.pdf
[2]Paul L. Rosin,“测量角点属性” http://users.cs.cf.ac.uk/Paul.Rosin/corner2.pdf
示例
>>> from skimage.morphology import octagon
>>> from skimage.feature import (corner_fast, corner_peaks,
...                              corner_orientations)
>>> square = np.zeros((12, 12))
>>> square[3:9, 3:9] = 1
>>> square.astype(int)
array([[0, 0, 0, 0, 0, 0, 0, 0, 0, 0, 0, 0],
       [0, 0, 0, 0, 0, 0, 0, 0, 0, 0, 0, 0],
       [0, 0, 0, 0, 0, 0, 0, 0, 0, 0, 0, 0],
       [0, 0, 0, 1, 1, 1, 1, 1, 1, 0, 0, 0],
       [0, 0, 0, 1, 1, 1, 1, 1, 1, 0, 0, 0],
       [0, 0, 0, 1, 1, 1, 1, 1, 1, 0, 0, 0],
       [0, 0, 0, 1, 1, 1, 1, 1, 1, 0, 0, 0],
       [0, 0, 0, 1, 1, 1, 1, 1, 1, 0, 0, 0],
       [0, 0, 0, 1, 1, 1, 1, 1, 1, 0, 0, 0],
       [0, 0, 0, 0, 0, 0, 0, 0, 0, 0, 0, 0],
       [0, 0, 0, 0, 0, 0, 0, 0, 0, 0, 0, 0],
       [0, 0, 0, 0, 0, 0, 0, 0, 0, 0, 0, 0]])
>>> corners = corner_peaks(corner_fast(square, 9), min_distance=1)
>>> corners
array([[3, 3],
       [3, 8],
       [8, 3],
       [8, 8]])
>>> orientations = corner_orientations(square, corners, octagon(3, 2))
>>> np.rad2deg(orientations)
array([  45.,  135.,  -45., -135.])
- skimage.feature.corner_peaks(image, min_distance=1, threshold_abs=None, threshold_rel=None, exclude_border=True, indices=True, num_peaks=inf, footprint=None, labels=None, *, num_peaks_per_label=inf, p_norm=inf)[source]#
在角点度量响应图像中查找峰值。
它与
skimage.feature.peak_local_max的不同之处在于,它会抑制具有相同累加器值的多个连接峰值。- 参数:
- image(M, N) ndarray
输入图像。
- min_distanceint, 可选
峰值之间的最小允许距离。
- **
- p_normfloat
要使用的 Minkowski p 范数。应在 [1, inf] 范围内。如果可能发生溢出,则有限的大 p 可能会导致 ValueError。
inf对应于切比雪夫距离,而 2 对应于欧几里得距离。
- 返回:
- outputndarray 或 bool 类型的 ndarray
如果
indices = True:峰值的 (行,列,…) 坐标。如果
indices = False:形状与image相同的布尔数组,其中峰值由 True 值表示。
注释
0.18 版本已更改:
threshold_rel的默认值已更改为 None,这意味着让skimage.feature.peak_local_max决定默认值。这等同于threshold_rel=0。num_peaks限制在抑制连接的峰之前应用。 要限制抑制后的峰的数量,请设置num_peaks=np.inf并后处理此函数的输出。示例
>>> from skimage.feature import peak_local_max
>>> response = np.zeros((5, 5))
>>> response[2:4, 2:4] = 1
>>> response
array([[0., 0., 0., 0., 0.],
       [0., 0., 0., 0., 0.],
       [0., 0., 1., 1., 0.],
       [0., 0., 1., 1., 0.],
       [0., 0., 0., 0., 0.]])
>>> peak_local_max(response)
array([[2, 2],
       [2, 3],
       [3, 2],
       [3, 3]])
>>> corner_peaks(response)
array([[2, 2]])
- skimage.feature.corner_shi_tomasi(image, sigma=1)[源代码]#
计算 Shi-Tomasi (Kanade-Tomasi) 角点度量响应图像。
此角点检测器使用自相关矩阵 A 的信息
A = [(imx**2)   (imx*imy)] = [Axx Axy]
    [(imx*imy)   (imy**2)]   [Axy Ayy]
其中 imx 和 imy 是使用高斯滤波器平均的一阶导数。然后,角点度量定义为 A 的较小特征值。
((Axx + Ayy) - sqrt((Axx - Ayy)**2 + 4 * Axy**2)) / 2
- 参数:
- image(M, N) ndarray
输入图像。
- sigmafloat,可选
用于高斯核的标准偏差,它用作自相关矩阵的加权函数。
- 返回:
- responsendarray
Shi-Tomasi 响应图像。
参考文献
示例
>>> from skimage.feature import corner_shi_tomasi, corner_peaks
>>> square = np.zeros([10, 10])
>>> square[2:8, 2:8] = 1
>>> square.astype(int)
array([[0, 0, 0, 0, 0, 0, 0, 0, 0, 0],
       [0, 0, 0, 0, 0, 0, 0, 0, 0, 0],
       [0, 0, 1, 1, 1, 1, 1, 1, 0, 0],
       [0, 0, 1, 1, 1, 1, 1, 1, 0, 0],
       [0, 0, 1, 1, 1, 1, 1, 1, 0, 0],
       [0, 0, 1, 1, 1, 1, 1, 1, 0, 0],
       [0, 0, 1, 1, 1, 1, 1, 1, 0, 0],
       [0, 0, 1, 1, 1, 1, 1, 1, 0, 0],
       [0, 0, 0, 0, 0, 0, 0, 0, 0, 0],
       [0, 0, 0, 0, 0, 0, 0, 0, 0, 0]])
>>> corner_peaks(corner_shi_tomasi(square), min_distance=1)
array([[2, 2],
       [2, 7],
       [7, 2],
       [7, 7]])
- skimage.feature.corner_subpix(image, corners, window_size=11, alpha=0.99)[源代码]#
确定角点的亚像素位置。
统计测试决定角点是定义为两条边的交点还是单个峰值。根据分类结果,亚像素角点位置基于灰度值的局部协方差确定。如果任何一个统计测试的显着性水平不足,则无法对角点进行分类,并且输出的亚像素位置设置为 NaN。
- 参数:
- image(M, N) ndarray
输入图像。
- corners(K, 2) ndarray
角点坐标
(行, 列)。- window_sizeint, 可选
用于亚像素估计的搜索窗口大小。
- alphafloat,可选
角点分类的显着性水平。
- 返回:
- positions(K, 2) ndarray
亚像素角点位置。 对于“未分类”的角点,为 NaN。
参考文献
[1]Förstner, W., & Gülch, E. (1987, 6月)。 用于检测和精确定位不同点、角点和圆形特征中心的快速算子。在摄影测量数据快速处理的 ISPRS 跨委员会会议论文集 (页 281-305)。https://cseweb.ucsd.edu/classes/sp02/cse252/foerstner/foerstner.pdf
示例
>>> from skimage.feature import corner_harris, corner_peaks, corner_subpix
>>> img = np.zeros((10, 10))
>>> img[:5, :5] = 1
>>> img[5:, 5:] = 1
>>> img.astype(int)
array([[1, 1, 1, 1, 1, 0, 0, 0, 0, 0],
       [1, 1, 1, 1, 1, 0, 0, 0, 0, 0],
       [1, 1, 1, 1, 1, 0, 0, 0, 0, 0],
       [1, 1, 1, 1, 1, 0, 0, 0, 0, 0],
       [1, 1, 1, 1, 1, 0, 0, 0, 0, 0],
       [0, 0, 0, 0, 0, 1, 1, 1, 1, 1],
       [0, 0, 0, 0, 0, 1, 1, 1, 1, 1],
       [0, 0, 0, 0, 0, 1, 1, 1, 1, 1],
       [0, 0, 0, 0, 0, 1, 1, 1, 1, 1],
       [0, 0, 0, 0, 0, 1, 1, 1, 1, 1]])
>>> coords = corner_peaks(corner_harris(img), min_distance=2)
>>> coords_subpix = corner_subpix(img, coords, window_size=7)
>>> coords_subpix
array([[4.5, 4.5]])
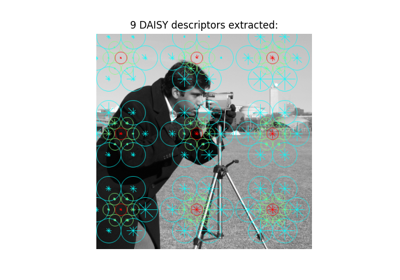
- skimage.feature.daisy(image, step=4, radius=15, rings=3, histograms=8, orientations=8, normalization='l1', sigmas=None, ring_radii=None, visualize=False)[源代码]#
为给定的图像密集提取 DAISY 特征描述符。
DAISY 是一种类似于 SIFT 的特征描述符,其公式允许快速密集提取。通常,这对于词袋图像表示是实用的。
该实现遵循 Tola 等人的方法 [1],但在以下几点上有所偏差
- 参数:
- image(M, N) 数组
输入图像(灰度)。
- stepint,可选
描述符采样点之间的距离。
- radiusint,可选
最外环的半径(以像素为单位)。
- ringsint,可选
环数。
- histogramsint,可选
每个环采样的直方图数。
- orientationsint,可选
每个直方图的方向(bin)数。
- normalization['l1' | 'l2' | 'daisy' | 'off'],可选
如何标准化描述符
'l1':每个描述符的 L1 标准化。
'l2':每个描述符的 L2 标准化。
'daisy':单个直方图的 L2 标准化。
'off':禁用标准化。
- sigmasfloat 的一维数组,可选
中心直方图和每个直方图环的空间高斯平滑的标准差。sigmas 数组应从中心向外排序。即,第一个 sigma 值定义中心直方图的空间平滑,最后一个 sigma 值定义最外环的空间平滑。指定 sigmas 会覆盖以下参数。
rings = len(sigmas) - 1- ring_radiiint 的一维数组,可选
每个环的半径(以像素为单位)。指定 ring_radii 会覆盖以下两个参数。
rings = len(ring_radii)radius = ring_radii[-1]如果同时给定了 sigmas 和 ring_radii,则它们必须满足以下谓词,因为中心直方图不需要半径。
len(ring_radii) == len(sigmas) + 1- visualizebool,可选
生成 DAISY 描述符的可视化
- 返回:
- descs数组
给定图像的 DAISY 描述符网格,维度为 (P, Q, R) 的数组,其中
P = ceil((M - radius*2) / step)Q = ceil((N - radius*2) / step)R = (rings * histograms + 1) * orientations- descs_img(M, N, 3) 数组 (仅当 visualize==True 时)
DAISY 描述符的可视化。
参考文献
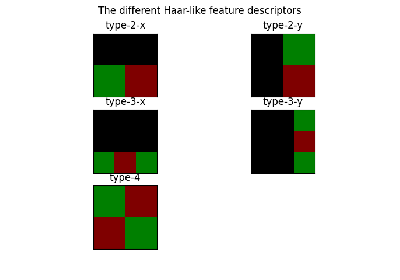
- skimage.feature.draw_haar_like_feature(image, r, c, width, height, feature_coord, color_positive_block=(1.0, 0.0, 0.0), color_negative_block=(0.0, 1.0, 0.0), alpha=0.5, max_n_features=None, rng=None)[源代码]#
Haar 样特征的可视化。
- 参数:
- image(M, N) ndarray
需要计算特征的积分图像区域。
- rint
检测窗口左上角的行坐标。
- cint
检测窗口左上角的列坐标。
- widthint
检测窗口的宽度。
- heightint
检测窗口的高度。
- feature_coord元组列表的 ndarray 或 None,可选
要提取的坐标数组。当您只想重新计算特征的子集时,此功能非常有用。在这种情况下,
feature_type需要是一个数组,其中包含每个特征的类型,正如haar_like_feature_coord()返回的那样。默认情况下,将计算所有坐标。- color_positive_block3 个浮点数的元组
指定正块颜色的浮点数。对应的值定义 (R, G, B) 值。默认值为红色 (1, 0, 0)。
- color_negative_block3 个浮点数的元组
指定负块颜色的浮点数。对应的值定义 (R, G, B) 值。默认值为蓝色 (0, 1, 0)。
- alpha浮点数
指定可视化不透明度的范围 [0, 1] 中的值。1 - 完全透明,0 - 不透明。
- max_n_features整数,默认值=None
要返回的最大特征数。默认情况下,将返回所有特征。
- rng{
numpy.random.Generator, 整数}, 可选 伪随机数生成器。默认情况下,使用 PCG64 生成器(请参阅
numpy.random.default_rng())。如果rng是一个整数,则它用于为生成器设定种子。当生成的特征集小于可用特征总数时,将使用 rng。
- 返回:
- features(M, N), ndarray
将在其中添加不同特征的图像。
示例
>>> import numpy as np
>>> from skimage.feature import haar_like_feature_coord
>>> from skimage.feature import draw_haar_like_feature
>>> feature_coord, _ = haar_like_feature_coord(2, 2, 'type-4')
>>> image = draw_haar_like_feature(np.zeros((2, 2)),
...                                0, 0, 2, 2,
...                                feature_coord,
...                                max_n_features=1)
>>> image
array([[[0. , 0.5, 0. ],
        [0.5, 0. , 0. ]],

       [[0.5, 0. , 0. ],
        [0. , 0.5, 0. ]]])
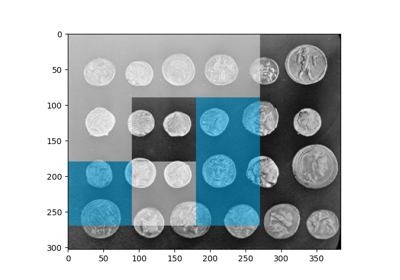
- skimage.feature.draw_multiblock_lbp(image, r, c, width, height, lbp_code=0, color_greater_block=(1, 1, 1), color_less_block=(0, 0.69, 0.96), alpha=0.5)[源代码]#
多块局部二值模式可视化。
总和较高的块用 alpha 混合的白色矩形着色,而总和较低的块用 alpha 混合的青色着色。可以更改颜色和
alpha参数。- 参数:
- image浮点数或 uint 的 ndarray
要在其上可视化图案的图像。
- rint
包含特征的矩形左上角的行坐标。
- cint
包含特征的矩形左上角的列坐标。
- widthint
将用于计算特征的 9 个相等矩形之一的宽度。
- heightint
将用于计算特征的 9 个相等矩形之一的高度。
- lbp_code整数
要可视化的特征的描述符。如果未提供,将使用值为 0 的描述符。
- color_greater_block3 个浮点数的元组
指定具有较大强度值的块的颜色的浮点数。它们应在范围 [0, 1] 内。对应的值定义 (R, G, B) 值。默认值为白色 (1, 1, 1)。
- color_greater_block3 个浮点数的元组
指定具有较大强度值的块的颜色的浮点数。它们应在范围 [0, 1] 内。对应的值定义 (R, G, B) 值。默认值为青色 (0, 0.69, 0.96)。
- alpha浮点数
指定可视化不透明度的范围 [0, 1] 中的值。1 - 完全透明,0 - 不透明。
- 返回:
- output浮点数的 ndarray
带有 MB-LBP 可视化的图像。
参考文献
[1]L. Zhang, R. Chu, S. Xiang, S. Liao, S.Z. Li. “基于多块 LBP 表示的人脸检测”,载于:生物识别进展国际会议论文集,ICB 2007,首尔,韩国。http://www.cbsr.ia.ac.cn/users/scliao/papers/Zhang-ICB07-MBLBP.pdf DOI:10.1007/978-3-540-74549-5_2
- skimage.feature.fisher_vector(descriptors, gmm, *, improved=False, alpha=0.5)[源代码]#
计算给定的一些描述符/向量和相关的估计 GMM 的 Fisher 向量。
- 参数:
- descriptorsnp.ndarray, shape=(n_descriptors, descriptor_length)
要为其计算 Fisher 向量表示的描述符的 NumPy 数组。
- gmm
sklearn.mixture.GaussianMixture 估计的 GMM 对象,其中包含计算 Fisher 向量所需的必要参数。
- improvedbool,默认值=False
表示是否计算改进的 Fisher 向量的标志。改进的 Fisher 向量已进行 L2 和幂归一化。幂归一化很简单,即对于某个 0 <= alpha <= 1,f(z) = sign(z) pow(abs(z), alpha)。
- alphafloat,默认值=0.5
幂归一化步骤的参数。如果 improved=False,则忽略。
- 返回:
- fisher_vectornp.ndarray
计算 Fisher 向量,它是通过 GMM 相对于其参数(混合权重、均值和协方差矩阵)的梯度串联给出的。对于 D 维输入描述符或向量,以及 K 模式 GMM,Fisher 向量维度将为 2KD + K。因此,其维度与描述符/向量的数量无关。
参考文献
[1]Perronnin, F. 和 Dance, C. 用于图像分类的视觉词汇上的 Fisher 核,IEEE 计算机视觉和模式识别会议,2007 年
[2]Perronnin, F. 和 Sanchez, J. 和 Mensink T. 改进用于大规模图像分类的 Fisher 核,ECCV,2010 年
示例
>>> from skimage.feature import fisher_vector, learn_gmm
>>> sift_for_images = [np.random.random((10, 128)) for _ in range(10)]
>>> num_modes = 16
>>> # Estimate 16-mode GMM with these synthetic SIFT vectors
>>> gmm = learn_gmm(sift_for_images, n_modes=num_modes)
>>> test_image_descriptors = np.random.random((25, 128))
>>> # Compute the Fisher vector
>>> fv = fisher_vector(test_image_descriptors, gmm)
- skimage.feature.graycomatrix(image, distances, angles, levels=None, symmetric=False, normed=False)[源代码]#
计算灰度共生矩阵。
灰度共生矩阵是图像上给定偏移处同时出现的灰度值的直方图。
在版本 0.19 中更改:
greymatrix在 0.19 中重命名为graymatrix。- 参数:
- image类数组
整数类型的输入图像。仅支持正值图像。如果类型不是 uint8,则需要设置参数
levels。- distances类数组
像素对距离偏移列表。
- angles类数组
像素对角度列表(以弧度表示)。
- levels整数,可选
输入图像应包含 [0,
levels-1] 中的整数,其中 levels 表示计数的灰度级数(对于 8 位图像,通常为 256)。对于 16 位或更高位的图像,此参数是必需的,并且通常是图像的最大值。由于输出矩阵至少为levelsxlevels,因此最好使用输入图像的分箱,而不是使用levels的较大值。- symmetricbool,可选
如果为 True,则输出矩阵
P[:, :, d, theta]是对称的。这是通过忽略值对的顺序来完成的,因此,当针对给定偏移量遇到 (i, j) 时,将累积 (i, j) 和 (j, i)。默认值为 False。- normedbool,可选
如果为 True,则通过除以给定偏移量的累积共生总数来归一化每个矩阵
P[:, :, d, theta]。结果矩阵的元素总和为 1。默认值为 False。
- 返回:
- P4-D ndarray
灰度共生直方图。值
P[i,j,d,theta]表示灰度级j在距离d和角度theta的位置相对于灰度级i出现的次数。如果normed为False,则输出类型为 uint32,否则为 float64。维度为:级别数 x 级别数 x 距离数 x 角度数。
参考文献
[1]M. Hall-Beyer, 2007. GLCM 纹理:教程 https://prism.ucalgary.ca/handle/1880/51900 DOI:
10.11575/PRISM/33280[2]R.M. Haralick, K. Shanmugam, and I. Dinstein, “用于图像分类的纹理特征”,IEEE 系统、人与控制论汇刊,卷 SMC-3,第 6 期,第 610-621 页,1973 年 11 月。 DOI:10.1109/TSMC.1973.4309314
[3]M. Nadler 和 E.P. Smith,《模式识别工程》,Wiley-Interscience,1993 年。
示例
使用 1 像素距离和 4 个不同角度计算 4 个 GLCM。例如,0 弧度的角度表示右侧相邻像素;pi/4 弧度表示右上对角线相邻像素;pi/2 弧度表示上方像素,依此类推。
>>> image = np.array([[0, 0, 1, 1],
...                   [0, 0, 1, 1],
...                   [0, 2, 2, 2],
...                   [2, 2, 3, 3]], dtype=np.uint8)
>>> result = graycomatrix(image, [1], [0, np.pi/4, np.pi/2, 3*np.pi/4],
...                       levels=4)
>>> result[:, :, 0, 0]
array([[2, 2, 1, 0],
       [0, 2, 0, 0],
       [0, 0, 3, 1],
       [0, 0, 0, 1]], dtype=uint32)
>>> result[:, :, 0, 1]
array([[1, 1, 3, 0],
       [0, 1, 1, 0],
       [0, 0, 0, 2],
       [0, 0, 0, 0]], dtype=uint32)
>>> result[:, :, 0, 2]
array([[3, 0, 2, 0],
       [0, 2, 2, 0],
       [0, 0, 1, 2],
       [0, 0, 0, 0]], dtype=uint32)
>>> result[:, :, 0, 3]
array([[2, 0, 0, 0],
       [1, 1, 2, 0],
       [0, 0, 2, 1],
       [0, 0, 0, 0]], dtype=uint32)
- skimage.feature.graycoprops(P, prop='contrast')[来源]#
计算 GLCM 的纹理属性。
计算灰度共生矩阵的特征,作为矩阵的简洁摘要。属性计算如下
“对比度”:\(\sum_{i,j=0}^{levels-1} P_{i,j}(i-j)^2\)
“差异性”:\(\sum_{i,j=0}^{levels-1}P_{i,j}|i-j|\)
“同质性”:\(\sum_{i,j=0}^{levels-1}\frac{P_{i,j}}{1+(i-j)^2}\)
“ASM”:\(\sum_{i,j=0}^{levels-1} P_{i,j}^2\)
“能量”:\(\sqrt{ASM}\)
- “相关性”
- \[\sum_{i,j=0}^{levels-1} P_{i,j}\left[\frac{(i-\mu_i) \ (j-\mu_j)}{\sqrt{(\sigma_i^2)(\sigma_j^2)}}\right]\]
“均值”:\(\sum_{i=0}^{levels-1} i*P_{i}\)
“方差”:\(\sum_{i=0}^{levels-1} P_{i}*(i-mean)^2\)
“标准差”:\(\sqrt{variance}\)
“熵”:\(\sum_{i,j=0}^{levels-1} -P_{i,j}*log(P_{i,j})\)
在计算纹理属性之前,每个 GLCM 都被归一化为总和为 1。
在 0.19 版本中更改:
greycoprops在 0.19 中重命名为graycoprops。- 参数:
- Pndarray
输入数组。
P是用于计算指定属性的灰度共生直方图。值P[i,j,d,theta]表示灰度级 j 在距离 d 和角度 theta 的位置相对于灰度级 i 出现的次数。- prop{‘contrast’, ‘dissimilarity’, ‘homogeneity’, ‘energy’, ‘correlation’, ‘ASM’, ‘mean’, ‘variance’, ‘std’, ‘entropy’}, optional
要计算的 GLCM 的属性。默认值为 ‘contrast’。
- 返回:
- results2 维 ndarray
二维数组。
results[d, a]是第 d 个距离和第 a 个角度的属性 'prop'。
参考文献
[1]M. Hall-Beyer,2007 年。GLCM 纹理:教程 v. 1.0 至 3.0。GLCM 教程主页,https://prism.ucalgary.ca/handle/1880/51900 DOI:
10.11575/PRISM/33280示例
计算距离为 [1, 2] 和角度为 [0 度,90 度] 的 GLCM 的对比度
>>> image = np.array([[0, 0, 1, 1],
...                   [0, 0, 1, 1],
...                   [0, 2, 2, 2],
...                   [2, 2, 3, 3]], dtype=np.uint8)
>>> g = graycomatrix(image, [1, 2], [0, np.pi/2], levels=4,
...                  normed=True, symmetric=True)
>>> contrast = graycoprops(g, 'contrast')
>>> contrast
array([[0.58333333, 1.        ],
       [1.25      , 2.75      ]])
- skimage.feature.haar_like_feature(int_image, r, c, width, height, feature_type=None, feature_coord=None)[来源]#
计算积分图像的感兴趣区域 (ROI) 的 Haar 样特征。
Haar-like 特征已成功用于图像分类和对象检测 [1]。它已用于 [2] 中提出的实时人脸检测算法。
- 参数:
- int_image(M, N) ndarray
需要计算特征的积分图像。
- rint
检测窗口左上角的行坐标。
- cint
检测窗口左上角的列坐标。
- widthint
检测窗口的宽度。
- heightint
检测窗口的高度。
- feature_typestr 或 str 列表或 None,可选
要考虑的特征类型
‘type-2-x’:沿 x 轴变化的 2 个矩形;
‘type-2-y’:沿 y 轴变化的 2 个矩形;
‘type-3-x’:沿 x 轴变化的 3 个矩形;
‘type-3-y’:沿 y 轴变化的 3 个矩形;
‘type-4’:沿 x 和 y 轴变化的 4 个矩形。
默认情况下,提取所有特征。
如果与
feature_coord一起使用,则应与每个关联的坐标特征的特征类型相对应。- feature_coord元组列表的 ndarray 或 None,可选
要提取的坐标数组。当您只想重新计算特征的子集时,此功能非常有用。在这种情况下,
feature_type需要是一个数组,其中包含每个特征的类型,正如haar_like_feature_coord()返回的那样。默认情况下,将计算所有坐标。
- 返回:
注释
当并行提取这些特征时,请注意后端的选择(即多进程与多线程)将对性能产生影响。经验法则是:在提取图像中所有可能的 ROI 的特征时,使用多进程;在为有限数量的 ROI 提取特定位置的特征时,使用多线程。有关更多见解,请参阅示例 使用 Haar-like 特征描述符进行人脸分类。
参考文献
[2]Oren, M., Papageorgiou, C., Sinha, P., Osuna, E., & Poggio, T. (1997, June). 使用小波模板的行人检测。在计算机视觉和模式识别,1997 年。论文集,1997 年 IEEE 计算机协会会议(第 193-199 页)。IEEE。http://tinyurl.com/y6ulxfta DOI:10.1109/CVPR.1997.609319
[3]Viola, Paul 和 Michael J. Jones。“稳健的实时人脸检测。”国际计算机视觉杂志 57.2 (2004): 137-154。 https://www.merl.com/publications/docs/TR2004-043.pdf DOI:10.1109/CVPR.2001.990517
示例
>>> import numpy as np
>>> from skimage.transform import integral_image
>>> from skimage.feature import haar_like_feature
>>> img = np.ones((5, 5), dtype=np.uint8)
>>> img_ii = integral_image(img)
>>> feature = haar_like_feature(img_ii, 0, 0, 5, 5, 'type-3-x')
>>> feature
array([-1, -2, -3, -4, -5, -1, -2, -3, -4, -5, -1, -2, -3, -4, -5, -1, -2,
       -3, -4, -1, -2, -3, -4, -1, -2, -3, -4, -1, -2, -3, -1, -2, -3, -1,
       -2, -3, -1, -2, -1, -2, -1, -2, -1, -1, -1])
您可以为一些预先计算的坐标计算特征。
>>> from skimage.feature import haar_like_feature_coord
>>> feature_coord, feature_type = zip(
...     *[haar_like_feature_coord(5, 5, feat_t)
...       for feat_t in ('type-2-x', 'type-3-x')])
>>> # only select one feature over two
>>> feature_coord = np.concatenate([x[::2] for x in feature_coord])
>>> feature_type = np.concatenate([x[::2] for x in feature_type])
>>> feature = haar_like_feature(img_ii, 0, 0, 5, 5,
...                             feature_type=feature_type,
...                             feature_coord=feature_coord)
>>> feature
array([ 0,  0,  0,  0,  0,  0,  0,  0,  0,  0,  0,  0,  0,  0,  0,  0,  0,
        0,  0,  0,  0,  0,  0,  0,  0,  0,  0,  0,  0,  0,  0,  0,  0,  0,
        0,  0,  0,  0,  0,  0,  0,  0,  0,  0,  0, -1, -3, -5, -2, -4, -1,
       -3, -5, -2, -4, -2, -4, -2, -4, -2, -1, -3, -2, -1, -1, -1, -1, -1])
- skimage.feature.haar_like_feature_coord(width, height, feature_type=None)[来源]#
计算 Haar 样特征的坐标。
- 参数:
- widthint
检测窗口的宽度。
- heightint
检测窗口的高度。
- feature_typestr 或 str 列表或 None,可选
要考虑的特征类型
‘type-2-x’:沿 x 轴变化的 2 个矩形;
‘type-2-y’:沿 y 轴变化的 2 个矩形;
‘type-3-x’:沿 x 轴变化的 3 个矩形;
‘type-3-y’:沿 y 轴变化的 3 个矩形;
‘type-4’:沿 x 和 y 轴变化的 4 个矩形。
默认情况下,提取所有特征。
- 返回:
- feature_coord(n_features, n_rectangles, 2, 2), 坐标元组列表的 ndarray
每个特征的矩形坐标。
- feature_type(n_features,), str 的 ndarray
每个特征的相应类型。
示例
>>> import numpy as np
>>> from skimage.transform import integral_image
>>> from skimage.feature import haar_like_feature_coord
>>> feat_coord, feat_type = haar_like_feature_coord(2, 2, 'type-4')
>>> feat_coord
array([ list([[(0, 0), (0, 0)], [(0, 1), (0, 1)],
              [(1, 1), (1, 1)], [(1, 0), (1, 0)]])], dtype=object)
>>> feat_type
array(['type-4'], dtype=object)
- skimage.feature.hessian_matrix(image, sigma=1, mode='constant', cval=0, order='rc', use_gaussian_derivatives=None)[源代码]#
计算 Hessian 矩阵。
在 2D 中,Hessian 矩阵定义为
H = [Hrr Hrc]
    [Hrc Hcc]
它是通过将图像与高斯核在各自的 r 和 c 方向上的二阶导数进行卷积来计算的。
此处的实现还支持 n 维数据。
- 参数:
- imagendarray
输入图像。
- sigma浮点数
用于高斯核的标准偏差,它用作自相关矩阵的加权函数。
- mode{‘constant’, ‘reflect’, ‘wrap’, ‘nearest’, ‘mirror’}, 可选
如何处理图像边界之外的值。
- cvalfloat,可选
与模式“constant”结合使用时,图像边界之外的值。
- order{‘rc’, ‘xy’}, 可选
对于 2D 图像,此参数允许在梯度计算中使用图像轴的倒序或正序。“rc”表示最初使用第一个轴(Hrr、Hrc、Hcc),而“xy”表示最初使用最后一个轴(Hxx、Hxy、Hyy)。具有更高维度的图像必须始终使用“rc”顺序。
- use_gaussian_derivatives布尔值, 可选
指示是否通过与高斯导数卷积或通过简单的有限差分运算来计算 Hessian 矩阵。
- 返回:
- H_elemsndarray 列表
输入图像中每个像素的 Hessian 矩阵的上对角元素。在 2D 中,这将是一个包含 [Hrr, Hrc, Hcc] 的三个元素列表。在 nD 中,该列表将包含
(n**2 + n) / 2个数组。
注释
导数和卷积的分配律允许我们将用高斯核 G 平滑的图像 I 的导数重述为图像与 G 的导数的卷积。
\[\frac{\partial }{\partial x_i}(I * G) = I * \left( \frac{\partial }{\partial x_i} G \right)\]当
use_gaussian_derivatives为True时,此属性用于计算构成 Hessian 矩阵的二阶导数。当
use_gaussian_derivatives为False时,则使用高斯平滑图像上的简单有限差分。示例
>>> from skimage.feature import hessian_matrix
>>> square = np.zeros((5, 5))
>>> square[2, 2] = 4
>>> Hrr, Hrc, Hcc = hessian_matrix(square, sigma=0.1, order='rc',
...                                use_gaussian_derivatives=False)
>>> Hrc
array([[ 0.,  0.,  0.,  0.,  0.],
       [ 0.,  1.,  0., -1.,  0.],
       [ 0.,  0.,  0.,  0.,  0.],
       [ 0., -1.,  0.,  1.,  0.],
       [ 0.,  0.,  0.,  0.,  0.]])
- skimage.feature.hessian_matrix_det(image, sigma=1, approximate=True)[源代码]#
计算图像上的近似 Hessian 行列式。
2D 近似方法使用积分图像上的盒式滤波器来计算近似 Hessian 行列式。
- 参数:
- imagendarray
计算 Hessian 行列式的图像。
- sigmafloat,可选
用于 Hessian 矩阵的高斯核的标准差。
- approximatebool, 可选
如果
True且图像为 2D,则使用更快的近似计算。此参数对 3D 和更高维度的图像没有影响。
- 返回:
- out数组
Hessian 行列式的数组。
注释
对于 2D 图像,当
approximate=True时,此方法的运行时间仅取决于图像的大小。它与预期的sigma无关。缺点是sigma小于3的结果不准确,即与某人计算 Hessian 并取其行列式获得的结果不相似。参考文献
[1]Herbert Bay, Andreas Ess, Tinne Tuytelaars, Luc Van Gool, “SURF: Speeded Up Robust Features” ftp://ftp.vision.ee.ethz.ch/publications/articles/eth_biwi_00517.pdf
- skimage.feature.hessian_matrix_eigvals(H_elems)[源代码]#
计算 Hessian 矩阵的特征值。
- 参数:
- H_elemsndarray 列表
Hessian 矩阵的上对角元素,由
hessian_matrix返回。
- 返回:
- eigsndarray
Hessian 矩阵的特征值,按降序排列。特征值是前导维度。也就是说,
eigs[i, j, k]包含位置 (j, k) 处的第 i 个最大特征值。
示例
>>> from skimage.feature import hessian_matrix, hessian_matrix_eigvals
>>> square = np.zeros((5, 5))
>>> square[2, 2] = 4
>>> H_elems = hessian_matrix(square, sigma=0.1, order='rc',
...                          use_gaussian_derivatives=False)
>>> hessian_matrix_eigvals(H_elems)[0]
array([[ 0.,  0.,  2.,  0.,  0.],
       [ 0.,  1.,  0.,  1.,  0.],
       [ 2.,  0., -2.,  0.,  2.],
       [ 0.,  1.,  0.,  1.,  0.],
       [ 0.,  0.,  2.,  0.,  0.]])
- skimage.feature.hog(image, orientations=9, pixels_per_cell=(8, 8), cells_per_block=(3, 3), block_norm='L2-Hys', visualize=False, transform_sqrt=False, feature_vector=True, *, channel_axis=None)[源代码]#
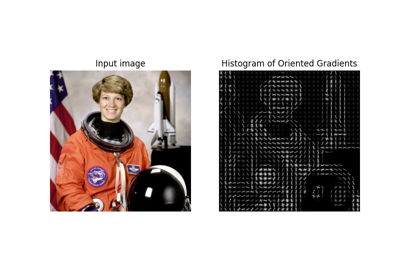
提取给定图像的定向梯度直方图 (HOG)。
通过以下方式计算定向梯度直方图 (HOG):
(可选)全局图像归一化
在
row和col中计算梯度图像计算梯度直方图
跨块归一化
展平为特征向量
- 参数:
- image(M, N[, C]) ndarray
输入图像。
- orientationsint,可选
方向箱的数量。
- pixels_per_cell2 元组 (int, int),可选
单元格的大小(以像素为单位)。
- cells_per_block2 元组 (int, int),可选
每个块中的单元格数。
- block_normstr {‘L1’, ‘L1-sqrt’, ‘L2’, ‘L2-Hys’}, 可选
块归一化方法
- visualizebool,可选
还返回 HOG 的图像。对于每个单元格和方向箱,图像都包含一条线段,该线段以单元格中心为中心,垂直于方向箱跨越的角度范围的中点,并且强度与相应的直方图值成正比。
- transform_sqrtbool, 可选
在处理之前应用幂律压缩来归一化图像。如果图像包含负值,请勿使用此选项。另请参见下面的
notes部分。- feature_vectorbool, 可选
通过在返回之前对结果调用 .ravel() 将数据作为特征向量返回。
- channel_axisint 或 None,可选
如果为 None,则假定该图像为灰度(单通道)图像。否则,此参数指示数组的哪个轴对应于通道。
0.19 版本中添加:
channel_axis在 0.19 版本中添加。
- 返回:
- out(n_blocks_row, n_blocks_col, n_cells_row, n_cells_col, n_orient) ndarray
图像的 HOG 描述符。如果
feature_vector为 True,则返回 1D(展平)数组。- hog_image(M, N) ndarray, 可选
HOG 图像的可视化。仅当
visualize为 True 时才提供。
- 引发:
- ValueError
如果考虑到 pixels_per_cell 和 cells_per_block 的值,图像太小。
注释
所提供的代码实现了 [2] 中的 HOG 提取方法,并进行了以下更改:(I)使用 (3, 3) 个单元格的块(论文中为 (2, 2) 个);(II)单元格内无平滑(论文中使用 sigma=8pix 的高斯空间窗口);(III)使用 L1 块归一化(论文中使用 L2-Hys)。
幂律压缩,也称为伽玛校正,用于减少阴影和光照变化的影响。压缩使黑暗区域变亮。当 kwarg
transform_sqrt设置为True时,该函数计算每个颜色通道的平方根,然后将 hog 算法应用于图像。参考文献
[2]Dalal, N and Triggs, B, Histograms of Oriented Gradients for Human Detection, IEEE Computer Society Conference on Computer Vision and Pattern Recognition 2005 San Diego, CA, USA, https://lear.inrialpes.fr/people/triggs/pubs/Dalal-cvpr05.pdf, DOI:10.1109/CVPR.2005.177
[3]Lowe, D.G., Distinctive image features from scale-invatiant keypoints, International Journal of Computer Vision (2004) 60: 91, http://www.cs.ubc.ca/~lowe/papers/ijcv04.pdf, DOI:10.1023/B:VISI.0000029664.99615.94
[4]Dalal, N, Finding People in Images and Videos, Human-Computer Interaction [cs.HC], Institut National Polytechnique de Grenoble - INPG, 2006, https://tel.archives-ouvertes.fr/tel-00390303/file/NavneetDalalThesis.pdf
- skimage.feature.learn_gmm(descriptors, *, n_modes=32, gm_args=None)[源代码]#
给定一组描述符和模式数量(即高斯分布),估计高斯混合模型 (GMM)。此函数本质上是 scikit-learn 中 GMM 实现的包装器,即
sklearn.mixture.GaussianMixture类。由于 Fisher 向量的特性,底层 scikit-learn 类唯一强制执行的参数是 covariance_type,它必须为 ‘diag’。
没有简单的方法可以预先知道
n_modes的使用值。通常,该值通常是{16, 32, 64, 128}中的一个。可以训练几个 GMM,然后选择使 GMM 的对数概率最大化的那个,或者选择n_modes,使在所得 Fisher 向量上训练的下游分类器的性能最大。- 参数:
- descriptorsnp.ndarray (N, M) 或 list [(N1, M), (N2, M), …]
用于估计 GMM 的描述符的 NumPy 数组列表或单个 NumPy 数组。允许使用 NumPy 数组列表的原因是,通常在使用 Fisher 向量编码时,会为数据集中的每个样本/图像单独计算描述符/向量,例如每个图像的 SIFT 向量。如果传入列表,则每个元素必须是一个 NumPy 数组,其中行数可能不同(例如,每个图像的 SIFT 向量数量不同),但每列的列数必须相同(即维度必须相同)。
- n_modesint
在 GMM 估计期间要估计的模式/高斯分布的数量。
- gm_argsdict
可以传递到底层 scikit-learn
sklearn.mixture.GaussianMixture类的关键字参数。
- 返回:
- gmm
sklearn.mixture.GaussianMixture 估计的 GMM 对象,其中包含计算 Fisher 向量所需的必要参数。
- gmm
参考文献
示例
>>> from skimage.feature import fisher_vector
>>> rng = np.random.Generator(np.random.PCG64())
>>> sift_for_images = [rng.standard_normal((10, 128)) for _ in range(10)]
>>> num_modes = 16
>>> # Estimate 16-mode GMM with these synthetic SIFT vectors
>>> gmm = learn_gmm(sift_for_images, n_modes=num_modes)
- skimage.feature.local_binary_pattern(image, P, R, method='default')[源代码]#
计算图像的局部二值模式 (LBP)。
LBP 是一种视觉描述符,常用于纹理分类。
- 参数:
- image(M, N) 数组
2D 灰度图像。
- Pint
圆形对称邻域集合点的数量(角度空间的量化)。
- Rfloat
圆的半径(算子的空间分辨率)。
- methodstr {‘default’, ‘ror’, ‘uniform’, ‘nri_uniform’, ‘var’}, optional
确定模式的方法
- 返回:
- output(M, N) array
LBP 图像。
参考文献
[1]T. Ojala, M. Pietikainen, T. Maenpaa, “使用局部二值模式进行多分辨率灰度和旋转不变纹理分类”,IEEE Transactions on Pattern Analysis and Machine Intelligence,第 24 卷,第 7 期,第 971-987 页,2002 年 7 月 DOI:10.1109/TPAMI.2002.1017623
[2]T. Ahonen, A. Hadid 和 M. Pietikainen。“使用局部二值模式进行人脸识别”,载于第八届欧洲计算机视觉会议论文集,布拉格,捷克共和国,2004 年 5 月 11-14 日,第 469-481 页,2004 年。http://citeseerx.ist.psu.edu/viewdoc/summary?doi=10.1.1.214.6851 DOI:10.1007/978-3-540-24670-1_36
[3]T. Ahonen, A. Hadid 和 M. Pietikainen,“使用局部二值模式进行人脸描述:人脸识别应用”,IEEE Transactions on Pattern Analysis and Machine Intelligence,第 28 卷,第 12 期,第 2037-2041 页,2006 年 12 月 DOI:10.1109/TPAMI.2006.244
- skimage.feature.match_descriptors(descriptors1, descriptors2, metric=None, p=2, max_distance=inf, cross_check=True, max_ratio=1.0)[源代码]#
描述符的暴力匹配。
对于第一组中的每个描述符,此匹配器会在第二组中找到最接近的描述符(并且在启用交叉检查的情况下,反之亦然)。
- 参数:
- descriptors1(M, P) array
第一个图像中关于 M 个关键点的 P 大小的描述符。
- descriptors2(N, P) array
第二个图像中关于 N 个关键点的 P 大小的描述符。
- metric{‘euclidean’, ‘cityblock’, ‘minkowski’, ‘hamming’, …} , optional
用于计算两个描述符之间距离的度量。有关所有可能的类型,请参见
scipy.spatial.distance.cdist。汉明距离应用于二进制描述符。默认情况下,L2 范数用于 dtype 为 float 或 double 的所有描述符,汉明距离自动用于二进制描述符。- pint, optional
要应用于
metric='minkowski'的 p 范数。- max_distancefloat, optional
单独图像中两个关键点的描述符之间视为匹配的最大允许距离。
- cross_checkbool, optional
如果为 True,则在交叉检查后返回匹配的关键点,即,如果 keypoint2 是第二张图像中 keypoint1 的最佳匹配,并且 keypoint1 是第一张图像中 keypoint2 的最佳匹配,则返回匹配对 (keypoint1, keypoint2)。
- max_ratiofloat, optional
第二组描述符中第一个和第二个最接近描述符之间距离的最大比率。此阈值对于过滤两个描述符集之间的模糊匹配非常有用。此值的选择取决于所选描述符的统计数据,例如,对于 SIFT 描述符,通常选择 0.8 的值,请参见 D.G. Lowe,“来自尺度不变关键点的独特图像特征”,国际计算机视觉杂志,2004 年。
- 返回:
- matches(Q, 2) array
第一组和第二组描述符中相应匹配项的索引,其中
matches[:, 0]表示第一组中的索引,matches[:, 1]表示第二组中的索引。
- skimage.feature.match_template(image, template, pad_input=False, mode='constant', constant_values=0)[源代码]#
使用归一化相关性将模板匹配到 2D 或 3D 图像。
输出是一个值介于 -1.0 和 1.0 之间的数组。给定位置的值对应于图像和模板之间的相关系数。
对于
pad_input=True,匹配对应于模板的中心,否则对应于模板的左上角。要找到最佳匹配,您必须在响应(输出)图像中搜索峰值。- 参数:
- image(M, N[, P]) 数组
二维或三维输入图像。
- template(m, n[, p]) 数组
要定位的模板。它必须满足
(m <= M, n <= N[, p <= P])。- pad_inputbool
如果为 True,则填充
image,使输出与图像大小相同,并且输出值对应于模板中心。否则,对于(M, N)图像和(m, n)模板,输出是一个形状为(M - m + 1, N - n + 1)的数组,并且匹配对应于模板的起始位置(左上角)。- mode请参阅
numpy.pad,可选 填充模式。
- constant_values请参阅
numpy.pad,可选 与
mode='constant'结合使用的常量值。
- 返回:
- output数组
带有相关系数的响应图像。
注释
有关互相关的详细信息,请参阅 [1]。此实现使用图像和模板的 FFT 卷积。参考文献 [2] 提出了类似的推导,但此参考文献中提出的近似值未在我们的实现中使用。
参考文献
[1]J. P. Lewis, “快速归一化互相关”, Industrial Light and Magic.
[2]Briechle 和 Hanebeck,“使用快速归一化互相关的模板匹配”,SPIE 会议论文集 (2001)。DOI:10.1117/12.421129
示例
>>> template = np.zeros((3, 3))
>>> template[1, 1] = 1
>>> template
array([[0., 0., 0.],
       [0., 1., 0.],
       [0., 0., 0.]])
>>> image = np.zeros((6, 6))
>>> image[1, 1] = 1
>>> image[4, 4] = -1
>>> image
array([[ 0.,  0.,  0.,  0.,  0.,  0.],
       [ 0.,  1.,  0.,  0.,  0.,  0.],
       [ 0.,  0.,  0.,  0.,  0.,  0.],
       [ 0.,  0.,  0.,  0.,  0.,  0.],
       [ 0.,  0.,  0.,  0., -1.,  0.],
       [ 0.,  0.,  0.,  0.,  0.,  0.]])
>>> result = match_template(image, template)
>>> np.round(result, 3)
array([[ 1.   , -0.125,  0.   ,  0.   ],
       [-0.125, -0.125,  0.   ,  0.   ],
       [ 0.   ,  0.   ,  0.125,  0.125],
       [ 0.   ,  0.   ,  0.125, -1.   ]])
>>> result = match_template(image, template, pad_input=True)
>>> np.round(result, 3)
array([[-0.125, -0.125, -0.125,  0.   ,  0.   ,  0.   ],
       [-0.125,  1.   , -0.125,  0.   ,  0.   ,  0.   ],
       [-0.125, -0.125, -0.125,  0.   ,  0.   ,  0.   ],
       [ 0.   ,  0.   ,  0.   ,  0.125,  0.125,  0.125],
       [ 0.   ,  0.   ,  0.   ,  0.125, -1.   ,  0.125],
       [ 0.   ,  0.   ,  0.   ,  0.125,  0.125,  0.125]])
- skimage.feature.multiblock_lbp(int_image, r, c, width, height)[source]#
多块局部二值模式 (MB-LBP)。
这些特征的计算方式与局部二值模式 (LBP) 类似(请参阅
local_binary_pattern()),但使用的是求和块而不是单个像素值。MB-LBP 是 LBP 的扩展,可以使用积分图像在恒定时间内在多个尺度上计算。使用九个大小相同的矩形来计算特征。对于每个矩形,计算像素强度的总和。将这些总和与中心矩形的总和进行比较,即可确定特征,类似于 LBP。
- 参数:
- int_image(N, M) 数组
积分图像。
- rint
包含特征的矩形左上角的行坐标。
- cint
包含特征的矩形左上角的列坐标。
- widthint
用于计算特征的 9 个大小相等的矩形之一的宽度。
- heightint
用于计算特征的 9 个大小相等的矩形之一的高度。
- 返回:
- outputint
8 位 MB-LBP 特征描述符。
参考文献
[1]L. Zhang, R. Chu, S. Xiang, S. Liao, S.Z. Li. “基于多块 LBP 表示的人脸检测”,载于:生物识别进展国际会议论文集,ICB 2007,首尔,韩国。http://www.cbsr.ia.ac.cn/users/scliao/papers/Zhang-ICB07-MBLBP.pdf DOI:10.1007/978-3-540-74549-5_2
- skimage.feature.multiscale_basic_features(image, intensity=True, edges=True, texture=True, sigma_min=0.5, sigma_max=16, num_sigma=None, num_workers=None, *, channel_axis=None)[source]#
单通道或多通道 nd 图像的局部特征。
由于高斯模糊,强度、梯度强度和局部结构会在不同的尺度上计算。
- 参数:
- imagendarray
输入图像,可以是灰度或多通道图像。
- intensitybool,默认为 True
如果为 True,则将不同尺度上平均的像素强度添加到特征集中。
- edgesbool,默认为 True
如果为 True,则将不同尺度上平均的局部梯度强度添加到特征集中。
- texturebool,默认为 True
如果为 True,则将不同尺度上高斯模糊后 Hessian 矩阵的特征值添加到特征集中。
- sigma_minfloat,可选
用于在提取特征之前平均局部邻域的高斯核的最小值。
- sigma_maxfloat,可选
用于在提取特征之前平均局部邻域的高斯核的最大值。
- num_sigmaint,可选
sigma_min 和 sigma_max 之间的高斯核值的数量。如果为 None,则使用 sigma_min 乘以 2 的幂。
- num_workersint 或 None,可选
要使用的并行线程数。如果设置为
None,则使用全部可用的核心。- channel_axisint 或 None,可选
如果为 None,则假定该图像为灰度(单通道)图像。否则,此参数指示数组的哪个轴对应于通道。
在版本 0.19 中添加:
channel_axis在 0.19 中添加。
- 返回:
- featuresnp.ndarray
形状为
image.shape + (n_features,)的数组。当channel_axis不为 None 时,所有通道都沿特征维度连接。(即n_features == n_features_singlechannel * n_channels)
- skimage.feature.peak_local_max(image, min_distance=1, threshold_abs=None, threshold_rel=None, exclude_border=True, num_peaks=inf, footprint=None, labels=None, num_peaks_per_label=inf, p_norm=inf)[source]#
在图像中查找峰值作为坐标列表。
峰值是
2 * min_distance + 1区域中的局部最大值(即,峰值之间至少间隔min_distance)。如果同时提供了
threshold_abs和threshold_rel,则选择两者中的较大值作为峰值的最小强度阈值。在版本 0.18 中更改:在版本 0.18 之前,会返回
min_distance半径内高度相同的峰值,但这可能会导致意外行为。从 0.18 开始,会返回该区域内的任意峰值。请参阅 issue gh-2592。- 参数:
- imagendarray
输入图像。
- min_distanceint, 可选
分隔峰值的最小允许距离。要找到最大峰值数,请使用
min_distance=1。- threshold_absfloat 或 None,可选
峰值的最小强度。默认情况下,绝对阈值是图像的最小强度。
- threshold_rel浮点数或 None,可选
峰值的最小强度,计算为
max(image) * threshold_rel。- exclude_borderint、int 元组或 bool,可选
如果为正整数,则
exclude_border会排除图像边界exclude_border像素内的峰值。如果为非负整数元组,则该元组的长度必须与输入数组的维度匹配。元组的每个元素将排除沿该维度图像边界exclude_border像素内的峰值。如果为 True,则将min_distance参数作为值。如果为零或 False,则无论峰值与边界的距离如何,都会识别峰值。- num_peaksint,可选
最大峰值数。当峰值数超过
num_peaks时,则根据最高峰值强度返回num_peaks个峰值。- footprint布尔值的 ndarray,可选
如果提供,
footprint == 1表示在image中每个点搜索峰值的局部区域。- labels整数类型的 ndarray,可选
如果提供,每个唯一的区域
labels == value表示一个要搜索峰值的唯一区域。0 保留给背景。- num_peaks_per_label整数,可选
每个标签的最大峰值数。
- p_normfloat
要使用的 Minkowski p 范数。应在 [1, inf] 范围内。如果可能发生溢出,则有限的大 p 可能会导致 ValueError。
inf对应于切比雪夫距离,而 2 对应于欧几里得距离。
- 返回:
- outputndarray
峰值的坐标。
注释
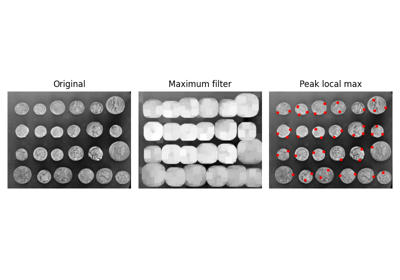
峰值局部最大值函数返回图像中局部峰值(最大值)的坐标。在内部,使用最大值滤波器来查找局部最大值。此操作会膨胀原始图像。在比较膨胀后的图像和原始图像后,此函数会返回膨胀后的图像等于原始图像的峰值的坐标。
示例
>>> img1 = np.zeros((7, 7))
>>> img1[3, 4] = 1
>>> img1[3, 2] = 1.5
>>> img1
array([[0. , 0. , 0. , 0. , 0. , 0. , 0. ],
       [0. , 0. , 0. , 0. , 0. , 0. , 0. ],
       [0. , 0. , 0. , 0. , 0. , 0. , 0. ],
       [0. , 0. , 1.5, 0. , 1. , 0. , 0. ],
       [0. , 0. , 0. , 0. , 0. , 0. , 0. ],
       [0. , 0. , 0. , 0. , 0. , 0. , 0. ],
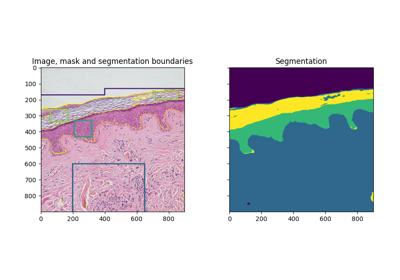
       [0. , 0. , 0. , 0. , 0. , 0. , 0. ]])
>>> peak_local_max(img1, min_distance=1)
array([[3, 2],
       [3, 4]])
>>> peak_local_max(img1, min_distance=2)
array([[3, 2]])
>>> img2 = np.zeros((20, 20, 20))
>>> img2[10, 10, 10] = 1
>>> img2[15, 15, 15] = 1
>>> peak_idx = peak_local_max(img2, exclude_border=0)
>>> peak_idx
array([[10, 10, 10],
       [15, 15, 15]])
>>> peak_mask = np.zeros_like(img2, dtype=bool)
>>> peak_mask[tuple(peak_idx.T)] = True
>>> np.argwhere(peak_mask)
array([[10, 10, 10],
       [15, 15, 15]])
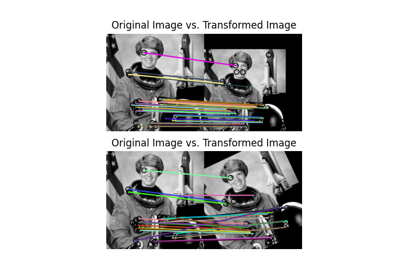
- skimage.feature.plot_matched_features(image0, image1, *, keypoints0, keypoints1, matches, ax, keypoints_color='k', matches_color=None, only_matches=False, alignment='horizontal')[source]#
绘制两个图像之间匹配的特征。
在 0.23 版本中添加。
- 参数:
- image0(N, M [, 3]) 数组
第一张图像。
- image1(N, M [, 3]) 数组
第二张图像。
- keypoints0(K1, 2) 数组
第一个关键点坐标,格式为
(行, 列)。- keypoints1(K2, 2) 数组
第二个关键点坐标,格式为
(行, 列)。- matches(Q, 2) array
第一个和第二个描述符集中对应匹配项的索引,其中
matches[:, 0](或matches[:, 1])包含第一个(或第二个)描述符集中的索引。- axmatplotlib.axes.Axes
绘制图像及其匹配特征的 Axes 对象。
- keypoints_colormatplotlib 颜色,可选
关键点位置的颜色。
- matches_colormatplotlib 颜色或颜色序列,可选
由
matches定义的连接关键点匹配的每条线的单一颜色或颜色序列。有关支持的颜色格式的概述,请参见 [1]。默认情况下,颜色是随机选择的。- only_matches布尔值,可选
设置为 True 仅绘制匹配项,而不绘制关键点位置。
- alignment{‘horizontal’, ‘vertical’},可选
是否并排显示两张图像(
'horizontal'),或一张图像在另一张图像之上('vertical')。
注释
要使传递给
matches_color的颜色序列适用于任意数量的matches,可以将该序列包装在itertools.cycle()中。参考文献
- skimage.feature.shape_index(image, sigma=1, mode='constant', cval=0)[source]#
计算形状索引。
形状索引,如 Koenderink & van Doorn [1] 所定义,是局部曲率的单值度量,假设图像为 3D 平面,强度表示高度。
它从 Hessian 的特征值导出,其值范围从 -1 到 1(并且在平坦区域中未定义 (=NaN)),以下范围表示以下形状
形状索引及其对应形状的范围。# 区间 (s 在 …)
形状
[ -1, -7/8)
球形凹面
[-7/8, -5/8)
槽
[-5/8, -3/8)
沟槽
[-3/8, -1/8)
鞍形沟槽
[-1/8, +1/8)
鞍形
[+1/8, +3/8)
鞍形脊
[+3/8, +5/8)
脊
[+5/8, +7/8)
穹顶
[+7/8, +1]
球形凸面
- 参数:
- image(M, N) ndarray
输入图像。
- sigmafloat,可选
用于高斯内核的标准偏差,用于在 Hessian 特征值计算之前平滑输入数据。
- mode{‘constant’, ‘reflect’, ‘wrap’, ‘nearest’, ‘mirror’}, 可选
如何处理图像边界外的值
- cvalfloat,可选
与模式“constant”结合使用时,图像边界之外的值。
- 返回:
- sndarray
形状索引
参考文献
[1]Koenderink, J. J. & van Doorn, A. J., “Surface shape and curvature scales”, Image and Vision Computing, 1992, 10, 557-564. DOI:10.1016/0262-8856(92)90076-F
示例
>>> from skimage.feature import shape_index
>>> square = np.zeros((5, 5))
>>> square[2, 2] = 4
>>> s = shape_index(square, sigma=0.1)
>>> s
array([[ nan,  nan, -0.5,  nan,  nan],
       [ nan, -0. ,  nan, -0. ,  nan],
       [-0.5,  nan, -1. ,  nan, -0.5],
       [ nan, -0. ,  nan, -0. ,  nan],
       [ nan,  nan, -0.5,  nan,  nan]])
- skimage.feature.structure_tensor(image, sigma=1, mode='constant', cval=0, order='rc')[source]#
使用平方差之和计算结构张量。
(二维)结构张量 A 定义为
A = [Arr Arc]
    [Arc Acc]
它通过图像中每个像素周围局部窗口中平方差的加权和来近似。此公式可以扩展到更多维度(请参见 [1])。
- 参数:
- imagendarray
输入图像。
- sigma浮点数或浮点数数组,可选
用于高斯内核的标准差,该内核用作平方差局部求和的加权函数。如果 sigma 是一个可迭代对象,则其长度必须等于
image.ndim,并且每个元素都用于沿其各自轴应用的高斯内核。- mode{‘constant’, ‘reflect’, ‘wrap’, ‘nearest’, ‘mirror’}, 可选
如何处理图像边界之外的值。
- cvalfloat,可选
与模式“constant”结合使用时,图像边界之外的值。
- order{‘rc’, ‘xy’}, 可选
注意:“xy”仅适用于二维图像,更高的维度必须始终使用“rc”顺序。此参数允许在梯度计算中使用图像轴的反向或正向顺序。“rc”表示最初使用第一个轴(Arr、Arc、Acc),而“xy”表示最初使用最后一个轴(Axx、Axy、Ayy)。
- 返回:
- A_elemsndarray 列表
输入图像中每个像素的结构张量的上对角线元素。
参考文献
示例
>>> from skimage.feature import structure_tensor
>>> square = np.zeros((5, 5))
>>> square[2, 2] = 1
>>> Arr, Arc, Acc = structure_tensor(square, sigma=0.1, order='rc')
>>> Acc
array([[0., 0., 0., 0., 0.],
       [0., 1., 0., 1., 0.],
       [0., 4., 0., 4., 0.],
       [0., 1., 0., 1., 0.],
       [0., 0., 0., 0., 0.]])
- skimage.feature.structure_tensor_eigenvalues(A_elems)[source]#
计算结构张量的特征值。
- 参数:
- A_elemsndarray 列表
结构张量的上对角线元素,由
structure_tensor返回。
- 返回:
- ndarray
结构张量的特征值,按降序排列。特征值是主要维度。也就是说,坐标 [i, j, k] 对应于位置 (j, k) 处第 i 个最大特征值。
另请参阅
示例
>>> from skimage.feature import structure_tensor
>>> from skimage.feature import structure_tensor_eigenvalues
>>> square = np.zeros((5, 5))
>>> square[2, 2] = 1
>>> A_elems = structure_tensor(square, sigma=0.1, order='rc')
>>> structure_tensor_eigenvalues(A_elems)[0]
array([[0., 0., 0., 0., 0.],
       [0., 2., 4., 2., 0.],
       [0., 4., 0., 4., 0.],
       [0., 2., 4., 2., 0.],
       [0., 0., 0., 0., 0.]])
- class skimage.feature.BRIEF(descriptor_size=256, patch_size=49, mode='normal', sigma=1, rng=1)[source]#
基类:
DescriptorExtractorBRIEF 二进制描述符提取器。
BRIEF(二进制鲁棒独立基本特征)是一种高效的特征点描述符。即使使用相对较少的位,它也具有很高的区分性,并且是使用简单的强度差异测试计算的。
对于每个关键点,对特定分布的 N 个像素对进行强度比较,从而产生长度为 N 的二进制描述符。对于二进制描述符,可以使用汉明距离进行特征匹配,与 L2 范数相比,这会降低计算成本。
- 参数:
- descriptor_size整数,可选
每个关键点的 BRIEF 描述符的大小。作者推荐的大小为 128、256 和 512。默认为 256。
- patch_size整数,可选
关键点周围二维方形斑块采样区域的长度。默认为 49。
- mode{‘normal’, ‘uniform’},可选
决策像素对在关键点周围采样位置的概率分布。
- rng{
numpy.random.Generator, 整数}, 可选 伪随机数生成器 (RNG)。默认情况下,使用 PCG64 生成器(参见
numpy.random.default_rng())。如果rng是一个整数,它将用于设置生成器的种子。PRNG 用于决策像素对的随机采样。从长度为
patch_size的正方形窗口中,使用mode参数采样像素对,并通过强度比较构建描述符。为了在图像之间进行匹配,应该使用相同的
rng来构建描述符。为了方便这一点rng默认为 1后续调用
extract方法将使用相同的 rng/种子。
- sigmafloat,可选
应用于图像以减轻噪声敏感性的高斯低通滤波器的标准偏差,强烈建议这样做以获得具有区分度和良好效果的描述符。
- 属性:
- descriptors(Q,
descriptor_size) 布尔类型数组 大小为
descriptor_size的 Q 个关键点的二进制描述符的二维 ndarray,在过滤掉边界关键点之后,索引(i, j)处的值为True或False,表示第 i 个关键点在第 j 个决策像素对上的强度比较结果。其中Q == np.sum(mask)。- mask(N,) 布尔类型数组
掩码指示关键点是否已被过滤掉(
False)或是在descriptors数组中描述(True)。
- descriptors(Q,
示例
>>> from skimage.feature import (corner_harris, corner_peaks, BRIEF,
...                              match_descriptors)
>>> import numpy as np
>>> square1 = np.zeros((8, 8), dtype=np.int32)
>>> square1[2:6, 2:6] = 1
>>> square1
array([[0, 0, 0, 0, 0, 0, 0, 0],
       [0, 0, 0, 0, 0, 0, 0, 0],
       [0, 0, 1, 1, 1, 1, 0, 0],
       [0, 0, 1, 1, 1, 1, 0, 0],
       [0, 0, 1, 1, 1, 1, 0, 0],
       [0, 0, 1, 1, 1, 1, 0, 0],
       [0, 0, 0, 0, 0, 0, 0, 0],
       [0, 0, 0, 0, 0, 0, 0, 0]], dtype=int32)
>>> square2 = np.zeros((9, 9), dtype=np.int32)
>>> square2[2:7, 2:7] = 1
>>> square2
array([[0, 0, 0, 0, 0, 0, 0, 0, 0],
       [0, 0, 0, 0, 0, 0, 0, 0, 0],
       [0, 0, 1, 1, 1, 1, 1, 0, 0],
       [0, 0, 1, 1, 1, 1, 1, 0, 0],
       [0, 0, 1, 1, 1, 1, 1, 0, 0],
       [0, 0, 1, 1, 1, 1, 1, 0, 0],
       [0, 0, 1, 1, 1, 1, 1, 0, 0],
       [0, 0, 0, 0, 0, 0, 0, 0, 0],
       [0, 0, 0, 0, 0, 0, 0, 0, 0]], dtype=int32)
>>> keypoints1 = corner_peaks(corner_harris(square1), min_distance=1)
>>> keypoints2 = corner_peaks(corner_harris(square2), min_distance=1)
>>> extractor = BRIEF(patch_size=5)
>>> extractor.extract(square1, keypoints1)
>>> descriptors1 = extractor.descriptors
>>> extractor.extract(square2, keypoints2)
>>> descriptors2 = extractor.descriptors
>>> matches = match_descriptors(descriptors1, descriptors2)
>>> matches
array([[0, 0],
       [1, 1],
       [2, 2],
       [3, 3]])
>>> keypoints1[matches[:, 0]]
array([[2, 2],
       [2, 5],
       [5, 2],
       [5, 5]])
>>> keypoints2[matches[:, 1]]
array([[2, 2],
       [2, 6],
       [6, 2],
       [6, 6]])
- class skimage.feature.CENSURE(min_scale=1, max_scale=7, mode='DoB', non_max_threshold=0.15, line_threshold=10)[源代码]#
基类:
FeatureDetectorCENSURE 关键点检测器。
- min_scaleint,可选
提取关键点的最小尺度。
- max_scaleint,可选
提取关键点的最大尺度。关键点将从所有尺度中提取,但第一个和最后一个除外,即从 [min_scale + 1, max_scale - 1] 范围内的尺度中提取。不同尺度的滤波器大小使得两个相邻尺度组成一个八度音阶。
- mode{‘DoB’, ‘Octagon’, ‘STAR’},可选
用于获取输入图像尺度的双层滤波器类型。可能的值为 ‘DoB’、‘Octagon’ 和 ‘STAR’。这三种模式分别表示双层滤波器的形状,即盒(正方形)、八边形和星形。例如,双层八边形滤波器由一个较小的内部八边形和一个较大的外部八边形组成,其中滤波器权重在内部八边形中均匀为负,而在差分区域中均匀为正。使用 STAR 和 Octagon 可以获得更好的特征,而使用 DoB 可以获得更好的性能。
- non_max_thresholdfloat,可选
用于抑制非极大值抑制后获得的响应幅度较弱的极大值和极小值的阈值。
- line_thresholdfloat,可选
用于拒绝主曲率比大于此值的兴趣点的阈值。
- 属性:
- keypoints(N, 2) 数组
关键点坐标,格式为
(行, 列)。- scales(N,) 数组
对应的尺度。
参考文献
[1]Motilal Agrawal, Kurt Konolige 和 Morten Rufus Blas “CENSURE: Center Surround Extremas for Realtime Feature Detection and Matching”,https://link.springer.com/chapter/10.1007/978-3-540-88693-8_8 DOI:10.1007/978-3-540-88693-8_8
[2]Adam Schmidt, Marek Kraft, Michal Fularz 和 Zuzanna Domagala “Comparative Assessment of Point Feature Detectors and Descriptors in the Context of Robot Navigation” http://yadda.icm.edu.pl/yadda/element/bwmeta1.element.baztech-268aaf28-0faf-4872-a4df-7e2e61cb364c/c/Schmidt_comparative.pdf DOI:10.1.1.465.1117
示例
>>> from skimage.data import astronaut
>>> from skimage.color import rgb2gray
>>> from skimage.feature import CENSURE
>>> img = rgb2gray(astronaut()[100:300, 100:300])
>>> censure = CENSURE()
>>> censure.detect(img)
>>> censure.keypoints
array([[  4, 148],
       [ 12,  73],
       [ 21, 176],
       [ 91,  22],
       [ 93,  56],
       [ 94,  22],
       [ 95,  54],
       [100,  51],
       [103,  51],
       [106,  67],
       [108,  15],
       [117,  20],
       [122,  60],
       [125,  37],
       [129,  37],
       [133,  76],
       [145,  44],
       [146,  94],
       [150, 114],
       [153,  33],
       [154, 156],
       [155, 151],
       [184,  63]])
>>> censure.scales
array([2, 6, 6, 2, 4, 3, 2, 3, 2, 6, 3, 2, 2, 3, 2, 2, 2, 3, 2, 2, 4, 2,
       2])
- class skimage.feature.Cascade#
基类:
object用于对象检测的分类器级联的类。
级联分类器的主要思想是创建中等精度的分类器,并将它们集成到一个强大的分类器中,而不是只创建一个强大的分类器。级联分类器的第二个优点是,可以通过仅评估级联中的一些分类器来对简单示例进行分类,从而使过程比评估一个强大的分类器的过程快得多。
- 属性:
- epscnp.float32_t
精度参数。增加它会使分类器检测到更少的假阳性,但同时假阴性分数会增加。
- stages_numberPy_ssize_t
级联中的阶段数。每个级联都由树桩组成,即训练过的特征。
- stumps_numberPy_ssize_t
级联所有阶段中树桩的总数。
- features_numberPy_ssize_t
级联使用的不同特征的总数。两个树桩可以使用相同的特征,但具有不同的训练值。
- window_widthPy_ssize_t
使用的检测窗口的宽度。无法检测到小于此窗口的对象。
- window_heightPy_ssize_t
检测窗口的高度。
- stagesStage*
指向使用 Stage 结构存储阶段信息的 C 数组的指针。
- featuresMBLBP*
指向使用 MBLBP 结构存储 MBLBP 特征的 C 数组的指针。
- LUTscnp.uint32_t*
指向 C 数组的指针,其中包含训练过的 MBLBP 特征 (MBLBPStumps) 用来评估特定区域的查找表。
注释
级联方法最初由 Viola 和 Jones 描述 [1],[2],尽管这些初始出版物使用了一组 Haar 状特征。此实现改为使用多尺度块局部二值模式 (MB-LBP) 特征 [3]。
参考文献
[1]Viola, P. 和 Jones, M. “使用简单特征的增强级联进行快速对象检测”,载于:2001 年 IEEE 计算机视觉和模式识别会议论文集。CVPR 2001,第 I-I 页。DOI:10.1109/CVPR.2001.990517
[2]Viola, P. 和 Jones, M.J, “鲁棒的实时人脸检测”,《国际计算机视觉杂志》57, 137–154 (2004)。DOI:10.1023/B:VISI.0000013087.49260.fb
[3]廖,S. 等人,用于人脸识别的学习多尺度块局部二值模式。《国际生物识别会议》(ICB), 2007, pp. 828-837. 收录于:《计算机科学讲义》,第 4642 卷。施普林格,柏林,海德堡。DOI:10.1007/978-3-540-74549-5_87
- __init__()#
初始化级联分类器。
- 参数:
- xml_file文件路径或文件对象
一个OpenCv格式的文件,从中加载所有级联分类器的参数。
- epscnp.float32_t
精度参数。增加它会使分类器检测到更少的假阳性,但同时假阴性分数会增加。
- detect_multi_scale(img, scale_factor, step_ratio, min_size, max_size, min_neighbor_number=4, intersection_score_threshold=0.5)#
在输入图像的多个尺度上搜索对象。
该函数接收输入图像,搜索窗口在每一步中相乘的比例因子,最小窗口大小和最大窗口大小,这些参数指定了应用于输入图像以检测对象的搜索窗口的间隔。
- 参数:
- img二维或三维 ndarray
表示输入图像的 Ndarray。
- scale_factorcnp.float32_t
搜索窗口在每一步中相乘的比例。
- step_ratiocnp.float32_t
图像的每个尺度上的搜索步长相乘的比率。1表示穷举搜索,通常速度较慢。通过将此参数设置为更高的值,结果会更差,但计算速度会快得多。通常,区间 [1, 1.5] 中的值会给出良好的结果。
- min_size元组 (int, int)
搜索窗口的最小大小。
- max_size元组 (int, int)
搜索窗口的最大大小。
- min_neighbor_numberint
为了使检测被该函数批准,所需的最小相交检测数量。
- intersection_score_thresholdcnp.float32_t
为了将两个检测合并为一个,比率(交集面积)/(较小矩形面积)的最小值。
- 返回:
- output字典列表
字典的形式为 {‘r’: int, ‘c’: int, ‘width’: int, ‘height’: int},其中 ‘r’ 表示检测到的窗口的左上角行的位置,’c’ 表示列位置,’width’ 表示检测到的窗口的宽度,’height’ 表示检测到的窗口的高度。
- eps#
- features_number#
- stages_number#
- stumps_number#
- window_height#
- window_width#
- class skimage.feature.ORB(downscale=1.2, n_scales=8, n_keypoints=500, fast_n=9, fast_threshold=0.08, harris_k=0.04)[源代码]#
基类:
FeatureDetector,DescriptorExtractor定向 FAST 和旋转 BRIEF 特征检测器和二进制描述符提取器。
- 参数:
- n_keypointsint, 可选
要返回的关键点数量。如果检测到的关键点多于
n_keypoints,则该函数将根据 Harris 角点响应返回最佳的n_keypoints。否则,将返回所有检测到的关键点。- fast_nint, 可选
skimage.feature.corner_fast中的n参数。圆上 16 个像素中连续像素的最小数量,这些像素相对于测试像素应该都更亮或更暗。如果Ic < Ip - threshold,则圆上的点 c 相对于测试像素 p 更暗,如果Ic > Ip + threshold,则更亮。也表示FAST-n角点检测器中的 n。- fast_thresholdfloat, 可选
feature.corner_fast中的threshold参数。用于决定圆上的像素相对于测试像素是更亮、更暗还是相似的阈值。当需要更多角点时,减小阈值,反之亦然。- harris_kfloat, 可选
skimage.feature.corner_harris中的k参数。将角点与边缘分离的灵敏度因子,通常在[0, 0.2]范围内。较小的k值会导致检测到锐角。- downscalefloat, 可选
图像金字塔的缩小比例因子。选择默认值 1.2 是为了有更密集的尺度,从而为后续的特征描述实现稳健的尺度不变性。
- n_scalesint, 可选
从图像金字塔底部提取特征的最大尺度数量。
- 属性:
- keypoints(N, 2) 数组
关键点坐标,格式为
(行, 列)。- scales(N,) 数组
对应的尺度。
- orientations(N,) 数组
相应的弧度方向。
- responses(N,) 数组
相应的 Harris 角点响应。
- descriptors(Q,
descriptor_size) 布尔类型数组 在滤除边界关键点之后,Q 个关键点的大小为
descriptor_size的二进制描述符的二维数组,索引(i, j)处的值为True或False,表示第 i 个关键点在第 j 个决策像素对上的强度比较结果。它是Q == np.sum(mask)。
参考文献
[1]Ethan Rublee, Vincent Rabaud, Kurt Konolige 和 Gary Bradski “ORB:SIFT 和 SURF 的高效替代方案” http://www.vision.cs.chubu.ac.jp/CV-R/pdf/Rublee_iccv2011.pdf
示例
>>> from skimage.feature import ORB, match_descriptors
>>> img1 = np.zeros((100, 100))
>>> img2 = np.zeros_like(img1)
>>> rng = np.random.default_rng(19481137)  # do not copy this value
>>> square = rng.random((20, 20))
>>> img1[40:60, 40:60] = square
>>> img2[53:73, 53:73] = square
>>> detector_extractor1 = ORB(n_keypoints=5)
>>> detector_extractor2 = ORB(n_keypoints=5)
>>> detector_extractor1.detect_and_extract(img1)
>>> detector_extractor2.detect_and_extract(img2)
>>> matches = match_descriptors(detector_extractor1.descriptors,
...                             detector_extractor2.descriptors)
>>> matches
array([[0, 0],
       [1, 1],
       [2, 2],
       [3, 4],
       [4, 3]])
>>> detector_extractor1.keypoints[matches[:, 0]]
array([[59. , 59. ],
       [40. , 40. ],
       [57. , 40. ],
       [46. , 58. ],
       [58.8, 58.8]])
>>> detector_extractor2.keypoints[matches[:, 1]]
array([[72., 72.],
       [53., 53.],
       [70., 53.],
       [59., 71.],
       [72., 72.]])
- __init__(downscale=1.2, n_scales=8, n_keypoints=500, fast_n=9, fast_threshold=0.08, harris_k=0.04)[源代码]#
- detect_and_extract(image)[源代码]#
检测定向的 FAST 关键点并提取 rBRIEF 描述符。
请注意,这比先调用
detect然后调用extract要快。- 参数:
- image二维数组
输入图像。
- extract(image, keypoints, scales, orientations)[源代码]#
为图像中给定的关键点提取 rBRIEF 二进制描述符。
请注意,必须使用相同的
downscale和n_scales参数提取关键点。此外,如果您想提取关键点和描述符,则应使用更快的detect_and_extract。- 参数:
- image二维数组
输入图像。
- keypoints(N, 2) 数组
关键点坐标,格式为
(行, 列)。- scales(N,) 数组
对应的尺度。
- orientations(N,) 数组
相应的弧度方向。
- class skimage.feature.SIFT(upsampling=2, n_octaves=8, n_scales=3, sigma_min=1.6, sigma_in=0.5, c_dog=0.013333333333333334, c_edge=10, n_bins=36, lambda_ori=1.5, c_max=0.8, lambda_descr=6, n_hist=4, n_ori=8)[源代码]#
基类:
FeatureDetector,DescriptorExtractorSIFT 特征检测和描述符提取。
- 参数:
- upsamplingint,可选
在特征检测之前,图像会按 1(不放大)、2 或 4 的因子放大。方法:双三次插值。
- n_octavesint,可选
最大八度音阶数。每增加一个八度音阶,图像大小会减半,sigma 会加倍。将根据需要减少八度音阶数,以使最小尺度下每个维度上至少保持 12 个像素。
- n_scalesint, 可选
每个八度音阶中的最大尺度数。
- sigma_minfloat,可选
种子图像的模糊级别。如果启用了上采样,则 sigma_min 会按 1/upsampling 的因子缩放
- sigma_infloat,可选
输入图像的假设模糊级别。
- c_dogfloat,可选
用于丢弃 DoG 中低对比度极值的阈值。它的最终值取决于 n_scales,关系为:final_c_dog = (2^(1/n_scales)-1) / (2^(1/3)-1) * c_dog
- c_edgefloat,可选
用于丢弃位于边缘的极值的阈值。如果 H 是极值的 Hessian,则其“边缘性”由 tr(H)²/det(H) 描述。如果边缘性高于 (c_edge + 1)²/c_edge,则丢弃该极值。
- n_binsint,可选
描述关键点周围梯度方向的直方图中的 bin 数。
- lambda_orifloat,可选
用于查找关键点参考方向的窗口宽度为 6 * lambda_ori * sigma,并且权重为 2 * lambda_ori * sigma 的标准差。
- c_maxfloat,可选
将方向直方图中的次峰值接受为方向的阈值
- lambda_descrfloat,可选
用于定义关键点描述符的窗口宽度为 2 * lambda_descr * sigma * (n_hist+1)/n_hist,并且权重为 lambda_descr * sigma 的标准差。
- n_histint,可选
用于定义关键点描述符的窗口由 n_hist * n_hist 个直方图组成。
- n_oriint,可选
描述符补丁的直方图中的 bin 数。
- 属性:
- delta_minfloat
第一个八度音阶的采样距离。它的最终值是 1/upsampling。
- float_dtypetype
图像的数据类型。
- scalespace_sigmas(n_octaves, n_scales + 3) 数组
所有八度音阶中所有尺度的 sigma 值。
- keypoints(N, 2) 数组
关键点坐标,格式为
(行, 列)。- positions(N, 2) 数组
亚像素精度关键点坐标,格式为
(行, 列)。- sigmas(N,) 数组
关键点的相应 sigma(模糊)值。
- scales(N,) 数组
关键点的相应尺度。
- orientations(N,) 数组
每个关键点周围的梯度方向。
- octaves(N,) 数组
关键点的相应八度音阶。
- descriptors(N, n_hist*n_hist*n_ori) 数组
关键点的描述符。
注释
SIFT 算法由 David Lowe 开发 [1],[2],后来由不列颠哥伦比亚大学获得专利。由于该专利于 2020 年到期,因此可以免费使用。这里的实现与 [3] 中的详细描述非常接近,包括使用相同的默认参数。
参考文献
[1]D.G. Lowe。“Object recognition from local scale-invariant features”,Proceedings of the Seventh IEEE International Conference on Computer Vision,1999 年,第 2 卷,第 1150-1157 页。DOI:10.1109/ICCV.1999.790410
[2]D.G. Lowe。“Distinctive Image Features from Scale-Invariant Keypoints”,International Journal of Computer Vision,2004 年,第 60 卷,第 91-110 页。DOI:10.1023/B:VISI.0000029664.99615.94
[3]I. R. Otero 和 M. Delbracio。“Anatomy of the SIFT Method”,Image Processing On Line,4 (2014),第 370–396 页。DOI:10.5201/ipol.2014.82
示例
>>> from skimage.feature import SIFT, match_descriptors
>>> from skimage.data import camera
>>> from skimage.transform import rotate
>>> img1 = camera()
>>> img2 = rotate(camera(), 90)
>>> detector_extractor1 = SIFT()
>>> detector_extractor2 = SIFT()
>>> detector_extractor1.detect_and_extract(img1)
>>> detector_extractor2.detect_and_extract(img2)
>>> matches = match_descriptors(detector_extractor1.descriptors,
...                             detector_extractor2.descriptors,
...                             max_ratio=0.6)
>>> matches[10:15]
array([[ 10, 412],
       [ 11, 417],
       [ 12, 407],
       [ 13, 411],
       [ 14, 406]])
>>> detector_extractor1.keypoints[matches[10:15, 0]]
array([[ 95, 214],
       [ 97, 211],
       [ 97, 218],
       [102, 215],
       [104, 218]])
>>> detector_extractor2.keypoints[matches[10:15, 1]]
array([[297,  95],
       [301,  97],
       [294,  97],
       [297, 102],
       [293, 104]])
- __init__(upsampling=2, n_octaves=8, n_scales=3, sigma_min=1.6, sigma_in=0.5, c_dog=0.013333333333333334, c_edge=10, n_bins=36, lambda_ori=1.5, c_max=0.8, lambda_descr=6, n_hist=4, n_ori=8)[源代码]#
- property deltas#
所有八度音阶的采样距离

