注意
转到末尾以下载完整的示例代码。或者通过 Binder 在浏览器中运行此示例
斑点检测#
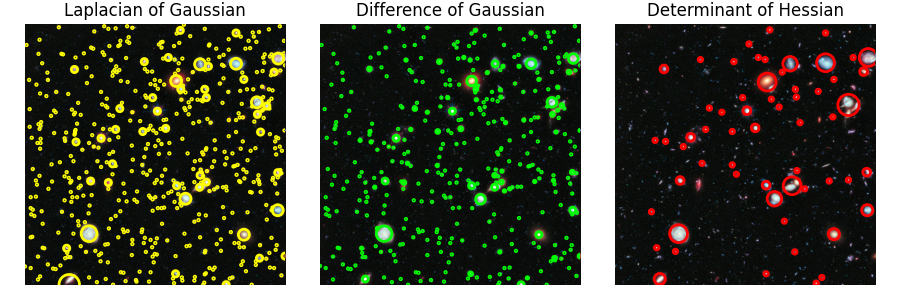
斑点是图像中亮区上的亮斑或暗区上的暗斑。在此示例中,使用 3 种算法检测斑点。本例中使用的图像是哈勃深空场。图像中的每个亮点都是一颗恒星或一个星系。
高斯拉普拉斯算子 (LoG)#
这是最准确但最慢的方法。它计算具有连续增加的标准偏差的高斯图像的拉普拉斯算子,并将它们堆叠在一个立方体中。斑点是此立方体中的局部最大值。由于卷积期间较大的内核尺寸,检测较大的斑点尤其慢。仅检测暗背景上的亮斑点。有关用法,请参阅 skimage.feature.blob_log()。
高斯差分 (DoG)#
这是 LoG 方法的更快近似。在这种情况下,图像会以逐渐增加的标准偏差进行模糊处理,并且两个连续模糊图像之间的差异会堆叠在一个立方体中。对于检测较大的斑点,此方法与 LoG 方法具有相同的缺点。斑点再次被假定为暗背景上的亮斑点。有关用法,请参阅 skimage.feature.blob_dog()。
黑塞矩阵行列式 (DoH)#
这是最快的方法。它通过查找图像的黑塞矩阵行列式中的最大值来检测斑点。检测速度与斑点的大小无关,因为内部实现使用盒式滤波器而不是卷积。检测暗背景上的亮斑点和亮背景上的暗斑点。缺点是不准确地检测小斑点 (<3px)。有关用法,请参阅 skimage.feature.blob_doh()。

from math import sqrt
from skimage import data
from skimage.feature import blob_dog, blob_log, blob_doh
from skimage.color import rgb2gray

import matplotlib.pyplot as plt


image = data.hubble_deep_field()[0:500, 0:500]
image_gray = rgb2gray(image)

blobs_log = blob_log(image_gray, max_sigma=30, num_sigma=10, threshold=0.1)

# Compute radii in the 3rd column.
blobs_log[:, 2] = blobs_log[:, 2] * sqrt(2)

blobs_dog = blob_dog(image_gray, max_sigma=30, threshold=0.1)
blobs_dog[:, 2] = blobs_dog[:, 2] * sqrt(2)

blobs_doh = blob_doh(image_gray, max_sigma=30, threshold=0.01)

blobs_list = [blobs_log, blobs_dog, blobs_doh]
colors = ['yellow', 'lime', 'red']
titles = ['Laplacian of Gaussian', 'Difference of Gaussian', 'Determinant of Hessian']
sequence = zip(blobs_list, colors, titles)

fig, axes = plt.subplots(1, 3, figsize=(9, 3), sharex=True, sharey=True)
ax = axes.ravel()

for idx, (blobs, color, title) in enumerate(sequence):
    ax[idx].set_title(title)
    ax[idx].imshow(image)
    for blob in blobs:
        y, x, r = blob
        c = plt.Circle((x, y), r, color=color, linewidth=2, fill=False)
        ax[idx].add_patch(c)
    ax[idx].set_axis_off()

plt.tight_layout()
plt.show()
脚本的总运行时间: (0 分钟 5.736 秒)
