注意
转到末尾下载完整的示例代码。或通过 Binder 在您的浏览器中运行此示例
使用图像修复技术恢复斑点角膜图像#
光学相干断层扫描 (OCT) 是一种非侵入性成像技术,眼科医生使用它来拍摄患者眼球后部的照片 [1]。在进行 OCT 时,灰尘可能会粘在设备的参考反射镜上,导致图像上出现黑点。问题在于这些污垢点会覆盖体内组织区域,从而隐藏感兴趣的数据。我们这里的目标是根据边界附近的像素恢复(重建)隐藏区域。
本教程改编自 Jules Scholler [2] 分享的一个应用程序。这些图像由 Viacheslav Mazlin 采集(请参阅skimage.data.palisades_of_vogt())。
import matplotlib.pyplot as plt
import numpy as np
import plotly.io
import plotly.express as px

import skimage as ski
我们这里使用的数据集是人体体内组织的一系列图像(一段影片!)。具体来说,它显示了给定角膜样本的沃格特栅栏。
加载图像数据#
image_seq = ski.data.palisades_of_vogt()

print(f'number of dimensions: {image_seq.ndim}')
print(f'shape: {image_seq.shape}')
print(f'dtype: {image_seq.dtype}')
number of dimensions: 3
shape: (60, 1440, 1440)
dtype: uint16
该数据集是一个具有 60 帧(时间点)和 2 个空间维度的图像堆栈。让我们通过每六个时间点采样来可视化 10 帧:我们可以看到照明的一些变化。我们利用 Plotly 的 imshow 函数中的 animation_frame 参数。顺便说一句,当 binary_string 参数设置为 True 时,图像将以灰度表示。
fig = px.imshow(
    image_seq[::6, :, :],
    animation_frame=0,
    binary_string=True,
    labels={'animation_frame': '6-step time point'},
    title='Sample of in-vivo human cornea',
)
fig.update_layout(autosize=False, minreducedwidth=250, minreducedheight=250)
plotly.io.show(fig)
随时间聚合#
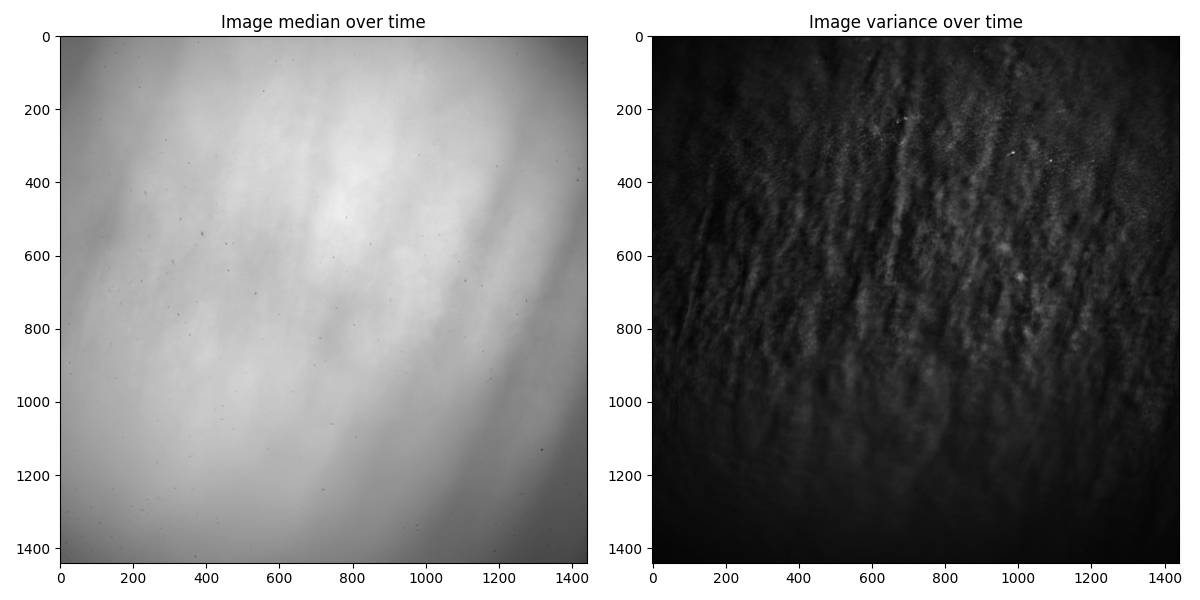
首先,我们要检测那些数据丢失的污垢点。用技术术语来说,我们想要分割污垢点(对于序列中的所有帧)。与实际数据(信号)不同,污垢点不会从一帧移动到下一帧;它们是静止的。因此,我们首先计算图像序列的时间聚合。我们将使用中值图像来分割污垢点,后者随后会相对于背景(模糊信号)突出显示。作为补充,为了了解(移动)数据,让我们计算方差。
image_med = np.median(image_seq, axis=0)
image_var = np.var(image_seq, axis=0)

assert image_var.shape == image_med.shape

print(f'shape: {image_med.shape}')

fig, ax = plt.subplots(ncols=2, figsize=(12, 6))

ax[0].imshow(image_med, cmap='gray')
ax[0].set_title('Image median over time')
ax[1].imshow(image_var, cmap='gray')
ax[1].set_title('Image variance over time')

fig.tight_layout()
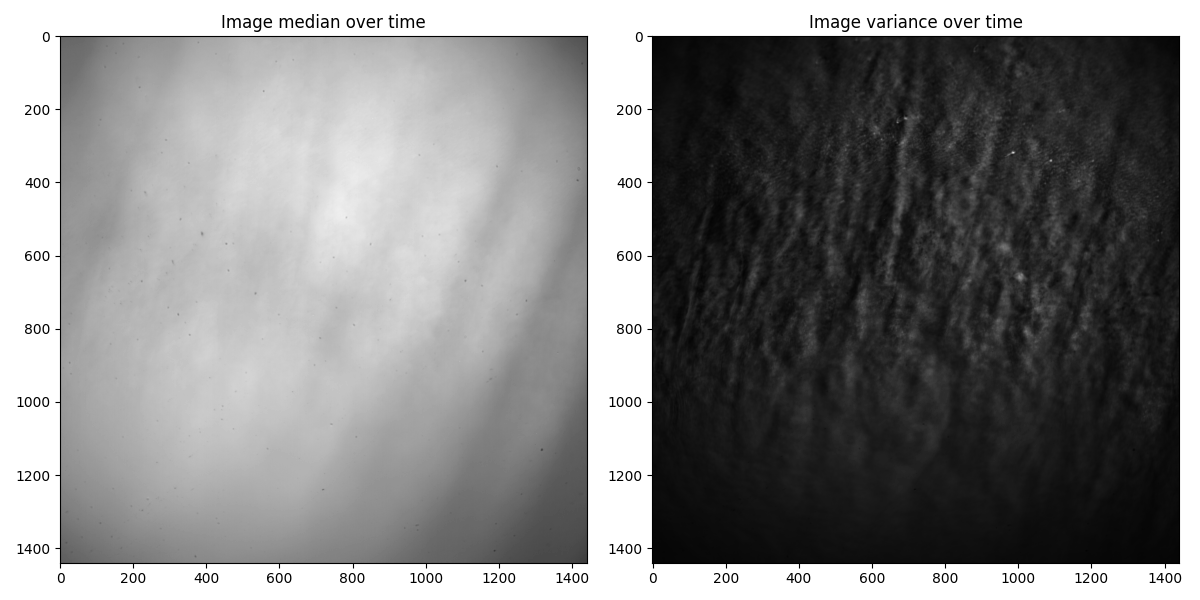
shape: (1440, 1440)
使用局部阈值处理#
为了分割污垢点,我们使用阈值处理。我们正在使用的图像光照不均匀,这会导致前景和背景的(绝对)强度出现空间变化。例如,一个区域的平均背景强度可能与另一个(遥远)区域不同。因此,跨图像计算不同的阈值(每个区域一个)更合适。这称为自适应(或局部)阈值处理,与通常的阈值处理程序不同,后者对图像中的所有像素使用单个(全局)阈值。
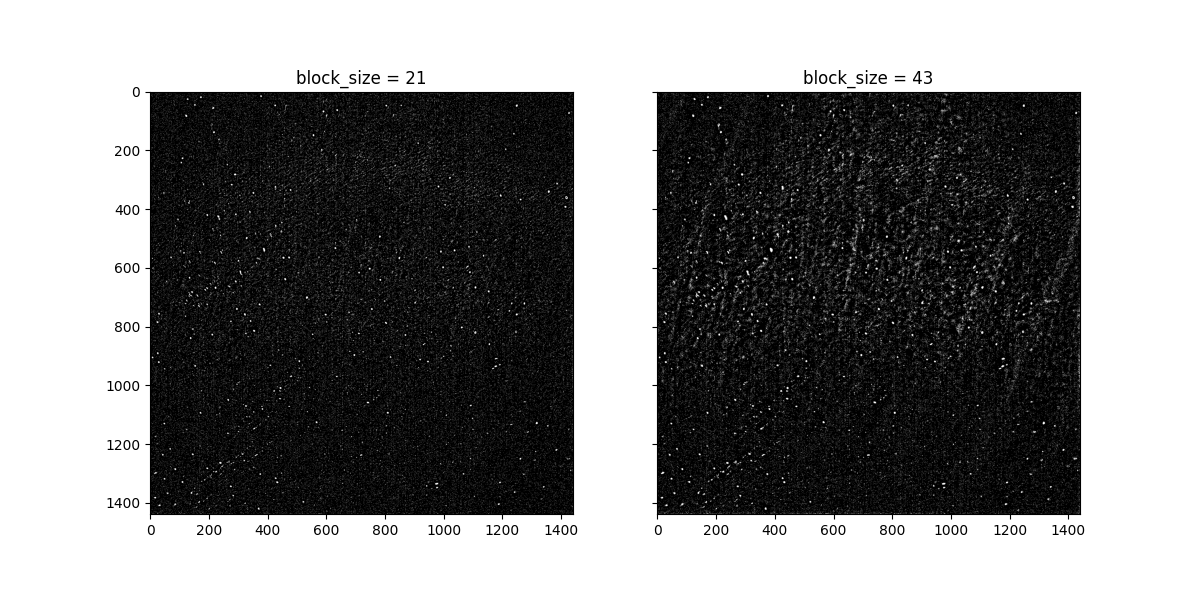
在从 filters 模块调用 threshold_local 函数时,我们可以更改默认的邻域大小(block_size),即光照变化的典型大小(像素数),以及 offset(移动邻域的加权平均值)。让我们尝试 block_size 的两个不同值
让我们定义一个方便函数来并排显示两个图,以便我们更容易比较它们
def plot_comparison(plot1, plot2, title1, title2):
    fig, (ax1, ax2) = plt.subplots(ncols=2, figsize=(12, 6), sharex=True, sharey=True)
    ax1.imshow(plot1, cmap='gray')
    ax1.set_title(title1)
    ax2.imshow(plot2, cmap='gray')
    ax2.set_title(title2)


plot_comparison(mask_1, mask_2, "block_size = 21", "block_size = 43")
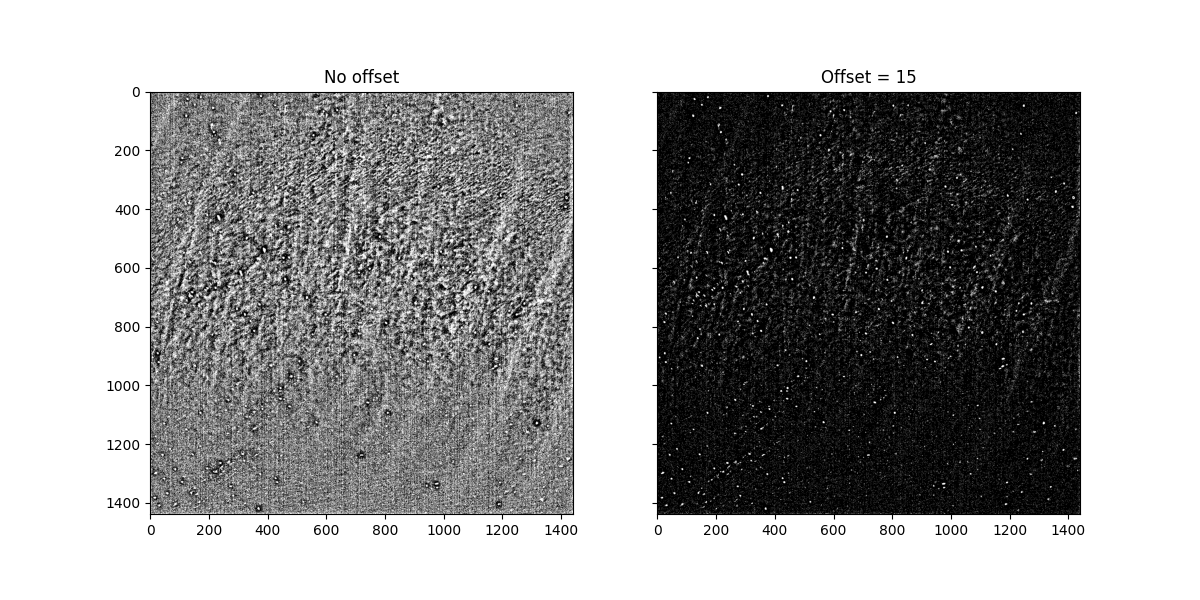
在第二个掩码(即使用较大的 block_size 值产生的掩码)中,“污垢点”似乎更清晰。我们注意到,将其默认零值增大偏移参数的值将产生更均匀的背景,从而使感兴趣的对象更加明显地突出。请注意,切换参数值可以使我们更深入地了解所使用的方法,这通常可以使我们更接近所需的结果。
移除细粒度特征#
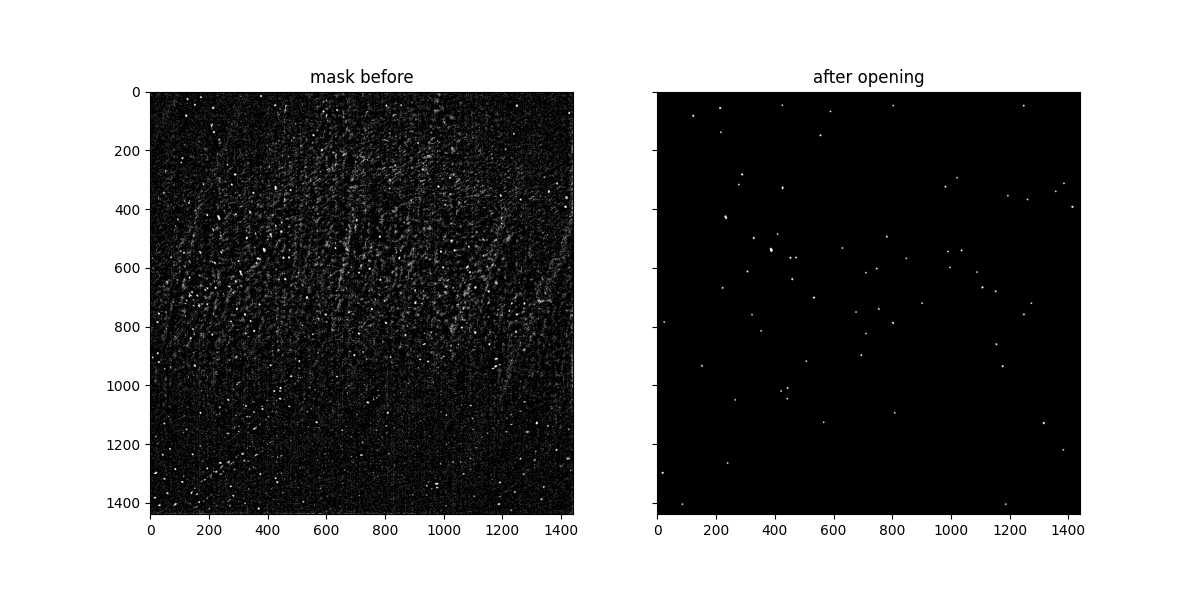
我们使用形态学滤波器来锐化掩膜,并聚焦于污点。两个基本的形态学算子是膨胀和腐蚀,其中膨胀(或腐蚀)将像素设置为由结构元素(足迹)定义的邻域中最亮(或最暗)的值。
这里,我们使用morphology模块中的diamond函数来创建一个菱形足迹。腐蚀后进行膨胀称为开运算。首先,我们应用开运算滤波器,以去除小的物体和细线,同时保留较大物体的形状和大小。
footprint = ski.morphology.diamond(3)
mask_open = ski.morphology.opening(mask_2, footprint)
plot_comparison(mask_2, mask_open, "mask before", "after opening")
由于图像的“开运算”以腐蚀操作开始,因此小于结构元素的明亮区域已被移除。当应用开运算滤波器时,调整足迹参数可以让我们控制移除特征的细粒度程度。例如,如果我们在上面使用footprint = ski.morphology.diamond(1),我们可以看到只有较小的特征会被过滤掉,从而在掩膜中保留更多的污点。相反,如果我们使用相同半径的盘状足迹,即footprint = ski.morphology.disk(3),那么更多的细粒度特征会被过滤掉,因为圆盘的面积比菱形大。
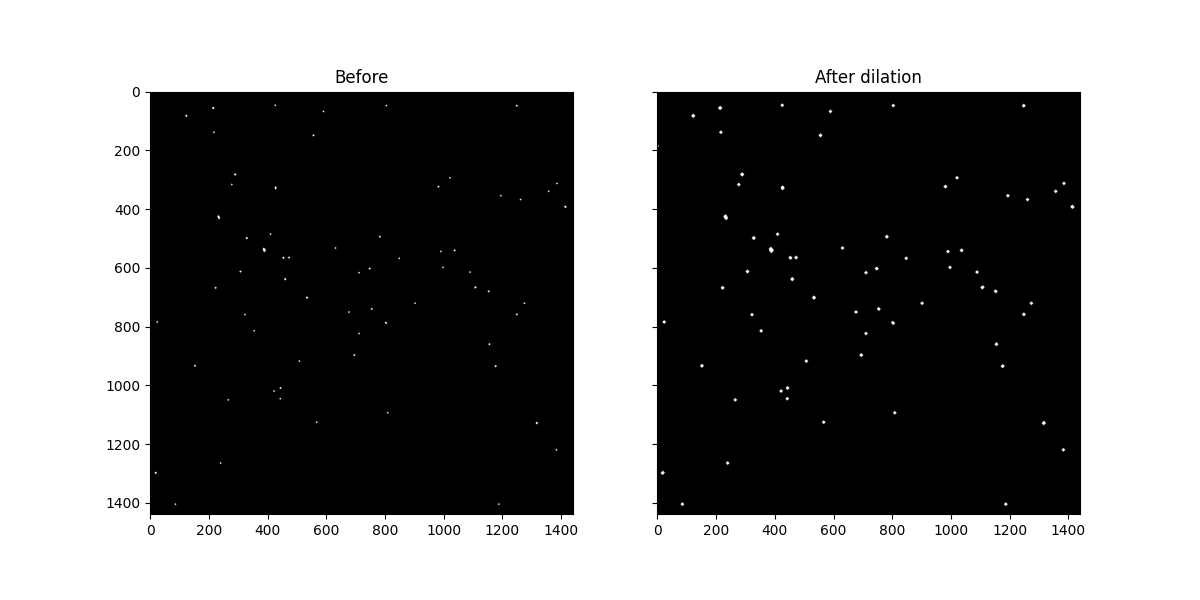
接下来,我们可以通过应用膨胀滤波器来扩大检测到的区域
mask_dilate = ski.morphology.dilation(mask_open, footprint)
plot_comparison(mask_open, mask_dilate, "Before", "After dilation")
膨胀会扩大明亮区域,缩小黑暗区域。请注意,白色斑点确实变粗了。
分别对每一帧进行修复#
现在我们准备好对每一帧应用修复。为此,我们使用restoration模块中的inpaint_biharmonic函数。它实现了一种基于双调和方程的算法。此函数接收两个数组作为输入:要修复的图像和一个与我们要修复的区域相对应的掩膜(具有相同的形状)。
image_seq_inpainted = np.zeros(image_seq.shape)

for i in range(image_seq.shape[0]):
    image_seq_inpainted[i] = ski.restoration.inpaint_biharmonic(
        image_seq[i], mask_dilate
    )
让我们可视化一个修复后的图像,其中污点已被修复。首先,我们找到污点(或者说是掩膜)的轮廓,以便我们可以将其绘制在修复后的图像之上
contours = ski.measure.find_contours(mask_dilate)

# Gather all (row, column) coordinates of the contours
x = []
y = []
for contour in contours:
    x.append(contour[:, 0])
    y.append(contour[:, 1])
# Note that the following one-liner is equivalent to the above:
# x, y = zip(*((contour[:, 0], contour[:, 1]) for contour in contours))

# Flatten the coordinates
x_flat = np.concatenate(x).ravel().round().astype(int)
y_flat = np.concatenate(y).ravel().round().astype(int)
# Create mask of these contours
contour_mask = np.zeros(mask_dilate.shape, dtype=bool)
contour_mask[x_flat, y_flat] = 1
# Pick one frame
sample_result = image_seq_inpainted[12]
# Normalize it (so intensity values range [0, 1])
sample_result /= sample_result.max()
我们使用color模块中的label2rgb函数,使用透明度(alpha 参数)将修复后的图像与分割的污点叠加起来。
color_contours = ski.color.label2rgb(
    contour_mask, image=sample_result, alpha=0.4, bg_color=(1, 1, 1)
)

fig, ax = plt.subplots(figsize=(6, 6))

ax.imshow(color_contours)
ax.set_title('Segmented spots over restored image')

fig.tight_layout()
请注意,位于 (x, y) ~ (719, 1237) 的污点很突出;理想情况下,它应该被分割和修复。我们可以看到,在删除细粒度特征时,我们在开运算处理步骤中“丢失”了它。
plt.show()
脚本的总运行时间:(0 分钟 29.329 秒)
