注意
转到末尾以下载完整的示例代码。或通过 Binder 在您的浏览器中运行此示例
使用薄板样条进行图像变形#
为了变形图像,我们从一组源坐标和目标坐标开始。目标是使图像变形,从而使源点移动到目标位置。通常,我们只知道少数选定源点的目标位置。为了计算所有其他像素位置的目标位置,我们需要一个模型。存在各种此类模型,例如仿射或投影变换。
大多数变换是线性的(即,它们保留直线),但有时我们需要更大的灵活性。表示非线性变换(即可以弯曲线条的变换)的一种模型是薄板样条 [1] [2]。
薄板样条借鉴了金属板的类比,金属板具有固有的刚性。考虑我们的源点:每个源点都必须在 x 和 y 方向上移动一定的距离,才能到达其对应的目标位置。首先,仅检查 x 坐标。想象一下将一块薄金属板放在图像顶部。现在弯曲它,使得在每个源点处,板的 z 偏移是在 x 方向上,该源点必须移动以到达其目标位置的距离(正或负)。该板抵抗弯曲,因此保持平滑。我们可以从板的位置读取源点以外的坐标的偏移量。对于 y 坐标,可以重复相同的过程。
这为我们提供了将任何 (x, y) 坐标映射到目标位置的薄板样条模型。
校正桶形失真#
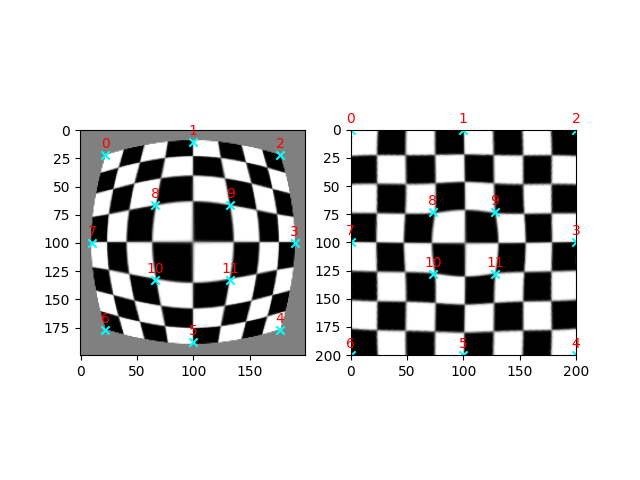
在此示例中,我们将演示如何使用薄板样条变换校正桶形失真 [3]。桶形失真会产生典型的鱼眼效果,其中图像放大率随着距图像中心距离的增加而减小。
我们首先通过将鱼眼变形应用于棋盘图像来生成示例数据集,然后再应用逆校正变换。
https://en.wikipedia.org/wiki/Distortion_(optics)#Radial_distortion

import matplotlib.pyplot as plt
import numpy as np

import skimage as ski


def radial_distortion(xy, k1=0.9, k2=0.5):
    """Distort coordinates `xy` symmetrically around their own center."""
    xy_c = xy.max(axis=0) / 2
    xy = (xy - xy_c) / xy_c
    radius = np.linalg.norm(xy, axis=1)
    distortion_model = (1 + k1 * radius + k2 * radius**2) * k2
    xy *= distortion_model.reshape(-1, 1)
    xy = xy * xy_c + xy_c
    return xy


image = ski.data.checkerboard()
image = ski.transform.warp(image, radial_distortion, cval=0.5)


# Pick a few `src` points by hand, and move the corresponding `dst` points to their
# expected positions.
# fmt: off
src = np.array([[22,  22], [100,  10], [177, 22], [190, 100], [177, 177], [100, 188],
                [22, 177], [ 10, 100], [ 66, 66], [133,  66], [ 66, 133], [133, 133]])
dst = np.array([[ 0,   0], [100,   0], [200,  0], [200, 100], [200, 200], [100, 200],
                [ 0, 200], [  0, 100], [ 73, 73], [128,  73], [ 73, 128], [128, 128]])
# fmt: on

# Estimate the TPS transformation from these points and then warp the image.
# We switch `src` and `dst` here because `skimage.transform.warp` requires the
# inverse transformation!
tps = ski.transform.ThinPlateSplineTransform()
tps.estimate(dst, src)
warped = ski.transform.warp(image, tps)


# Plot the results
fig, axs = plt.subplots(1, 2)
axs[0].imshow(image, cmap='gray')
axs[0].scatter(src[:, 0], src[:, 1], marker='x', color='cyan')
axs[1].imshow(warped, cmap='gray', extent=(0, 200, 200, 0))
axs[1].scatter(dst[:, 0], dst[:, 1], marker='x', color='cyan')

point_labels = [str(i) for i in range(len(src))]
for i, label in enumerate(point_labels):
    axs[0].annotate(
        label,
        (src[:, 0][i], src[:, 1][i]),
        textcoords="offset points",
        xytext=(0, 5),
        ha='center',
        color='red',
    )
    axs[1].annotate(
        label,
        (dst[:, 0][i], dst[:, 1][i]),
        textcoords="offset points",
        xytext=(0, 5),
        ha='center',
        color='red',
    )

plt.show()
脚本的总运行时间: (0 分 0.309 秒)
