注意
转到结尾 下载完整的示例代码。 或者通过 Binder 在浏览器中运行此示例
特定图像#
import matplotlib.pyplot as plt
import matplotlib

from skimage import data

matplotlib.rcParams["font.size"] = 18
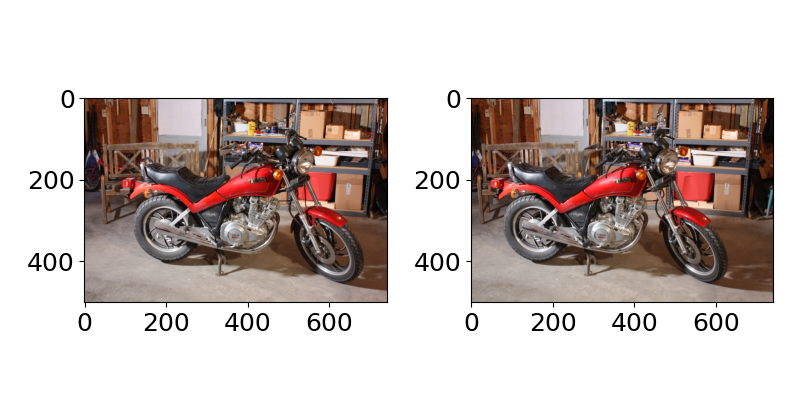
立体图像#
fig, axes = plt.subplots(1, 2, figsize=(8, 4))
ax = axes.ravel()

cycle_images = data.stereo_motorcycle()
ax[0].imshow(cycle_images[0])
ax[1].imshow(cycle_images[1])

fig.tight_layout()
plt.show()

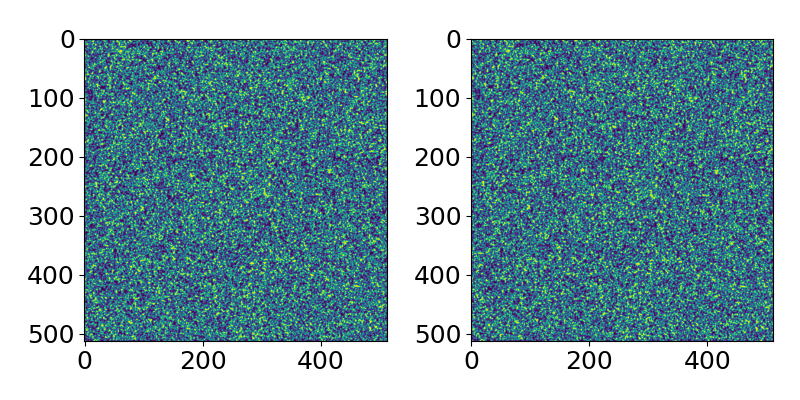
PIV 图像#
fig, axes = plt.subplots(1, 2, figsize=(8, 4))
ax = axes.ravel()

vortex_images = data.vortex()
ax[0].imshow(vortex_images[0])
ax[1].imshow(vortex_images[1])

fig.tight_layout()
plt.show()

Downloading file 'data/pivchallenge-B-B001_1.tif' from 'https://gitlab.com/scikit-image/data/-/raw/2cdc5ce89b334d28f06a58c9f0ca21aa6992a5ba/pivchallenge/B/B001_1.tif' to '/home/runner/.cache/scikit-image/0.25.0'.
Downloading file 'data/pivchallenge-B-B001_2.tif' from 'https://gitlab.com/scikit-image/data/-/raw/2cdc5ce89b334d28f06a58c9f0ca21aa6992a5ba/pivchallenge/B/B001_2.tif' to '/home/runner/.cache/scikit-image/0.25.0'.
人脸和非人脸数据集#
显示了 200 多张图像中的 20 个样本。
fig, axes = plt.subplots(4, 5, figsize=(20, 20))
ax = axes.ravel()
lfw_images = data.lfw_subset()
for i in range(20):
    ax[i].imshow(lfw_images[90 + i], cmap=plt.cm.gray)
    ax[i].axis("off")
fig.tight_layout()
plt.show()

图库的缩略图
from matplotlib.offsetbox import AnchoredText

# Create a gridspec with two images in the first and 4 in the second row
fig, axd = plt.subplot_mosaic(
    [["stereo", "stereo", "piv", "piv"], ["lfw0", "lfw1", "lfw2", "lfw3"]],
)
axd["stereo"].imshow(cycle_images[0])
axd["stereo"].add_artist(
    AnchoredText(
        "Stereo",
        prop=dict(size=20),
        frameon=True,
        borderpad=0,
        loc="upper left",
    )
)
axd["piv"].imshow(vortex_images[0])
axd["piv"].add_artist(
    AnchoredText(
        "PIV",
        prop=dict(size=20),
        frameon=True,
        borderpad=0,
        loc="upper left",
    )
)
axd["lfw0"].imshow(lfw_images[91], cmap="gray")
axd["lfw1"].imshow(lfw_images[92], cmap="gray")
axd["lfw2"].imshow(lfw_images[93], cmap="gray")
axd["lfw3"].imshow(lfw_images[94], cmap="gray")

for ax in axd.values():
    ax.axis("off")
fig.tight_layout()
plt.show()

脚本的总运行时间: (0 分钟 3.103 秒)
