注意
转到末尾下载完整的示例代码。或通过 Binder 在浏览器中运行此示例
使用极坐标和对数极坐标变换进行配准#
相位相关(registration.phase_cross_correlation)是一种有效的确定相似图像对之间平移偏移量的方法。但是,这种方法依赖于图像之间几乎不存在旋转/缩放差异,这在现实世界的示例中很典型。
为了恢复两个图像之间的旋转和缩放差异,我们可以利用对数极坐标变换的两个几何特性和频域的平移不变性。首先,笛卡尔空间中的旋转变为沿对数极坐标空间的角坐标(\(\theta\))轴的平移。其次,笛卡尔空间中的缩放变为沿对数极坐标空间的径向坐标(\(\rho = \ln\sqrt{x^2 + y^2}\))的平移。最后,空间域中的平移差异不会影响频域中的幅度谱。
在这一系列示例中,我们将基于这些概念来展示如何将对数极坐标变换 transform.warp_polar 与相位相关结合使用,以恢复两个图像之间也存在平移偏移的旋转和缩放差异。
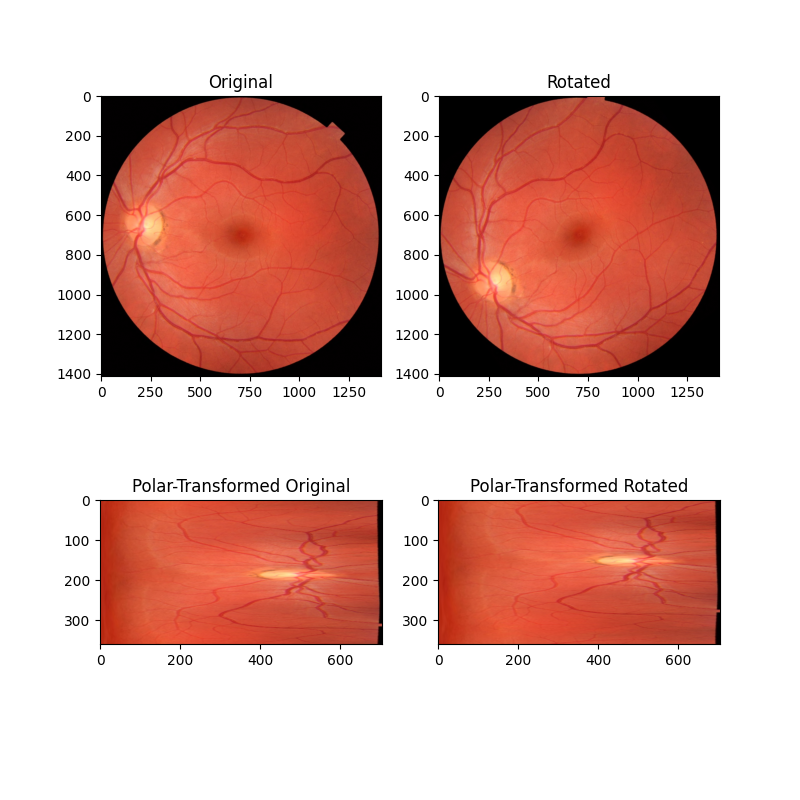
使用极坐标变换恢复旋转差异#
在第一个示例中,我们考虑两个图像仅在绕共同中心点旋转方面不同的简单情况。通过将这些图像重新映射到极坐标空间中,旋转差异变成了一个简单的平移差异,可以通过相位相关恢复。
import numpy as np
import matplotlib.pyplot as plt

from skimage import data
from skimage.registration import phase_cross_correlation
from skimage.transform import warp_polar, rotate, rescale
from skimage.util import img_as_float

radius = 705
angle = 35
image = data.retina()
image = img_as_float(image)
rotated = rotate(image, angle)
image_polar = warp_polar(image, radius=radius, channel_axis=-1)
rotated_polar = warp_polar(rotated, radius=radius, channel_axis=-1)

fig, axes = plt.subplots(2, 2, figsize=(8, 8))
ax = axes.ravel()
ax[0].set_title("Original")
ax[0].imshow(image)
ax[1].set_title("Rotated")
ax[1].imshow(rotated)
ax[2].set_title("Polar-Transformed Original")
ax[2].imshow(image_polar)
ax[3].set_title("Polar-Transformed Rotated")
ax[3].imshow(rotated_polar)
plt.show()

shifts, error, phasediff = phase_cross_correlation(
    image_polar, rotated_polar, normalization=None
)
print(f'Expected value for counterclockwise rotation in degrees: ' f'{angle}')
print(f'Recovered value for counterclockwise rotation: ' f'{shifts[0]}')

Expected value for counterclockwise rotation in degrees: 35
Recovered value for counterclockwise rotation: 35.0
使用对数极坐标变换恢复旋转和缩放差异#
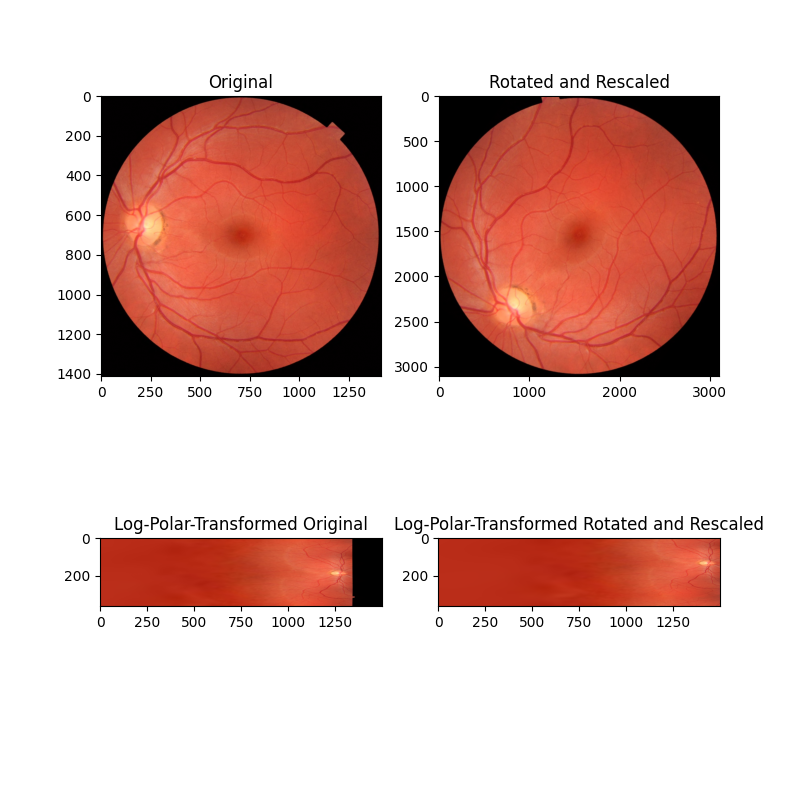
在第二个示例中,图像在旋转和缩放方面都不同(注意轴刻度值)。通过将这些图像重新映射到对数极坐标空间中,我们可以像以前一样恢复旋转,现在还可以通过相位相关恢复缩放。
# radius must be large enough to capture useful info in larger image
radius = 1500
angle = 53.7
scale = 2.2
image = data.retina()
image = img_as_float(image)
rotated = rotate(image, angle)
rescaled = rescale(rotated, scale, channel_axis=-1)
image_polar = warp_polar(image, radius=radius, scaling='log', channel_axis=-1)
rescaled_polar = warp_polar(rescaled, radius=radius, scaling='log', channel_axis=-1)

fig, axes = plt.subplots(2, 2, figsize=(8, 8))
ax = axes.ravel()
ax[0].set_title("Original")
ax[0].imshow(image)
ax[1].set_title("Rotated and Rescaled")
ax[1].imshow(rescaled)
ax[2].set_title("Log-Polar-Transformed Original")
ax[2].imshow(image_polar)
ax[3].set_title("Log-Polar-Transformed Rotated and Rescaled")
ax[3].imshow(rescaled_polar)
plt.show()

# setting `upsample_factor` can increase precision
shifts, error, phasediff = phase_cross_correlation(
    image_polar, rescaled_polar, upsample_factor=20, normalization=None
)
shiftr, shiftc = shifts[:2]

# Calculate scale factor from translation
klog = radius / np.log(radius)
shift_scale = 1 / (np.exp(shiftc / klog))

print(f'Expected value for cc rotation in degrees: {angle}')
print(f'Recovered value for cc rotation: {shiftr}')
print()
print(f'Expected value for scaling difference: {scale}')
print(f'Recovered value for scaling difference: {shift_scale}')

Expected value for cc rotation in degrees: 53.7
Recovered value for cc rotation: 53.75

Expected value for scaling difference: 2.2
Recovered value for scaling difference: 2.1981889915232165
在平移图像上注册旋转和缩放 - 第 1 部分#
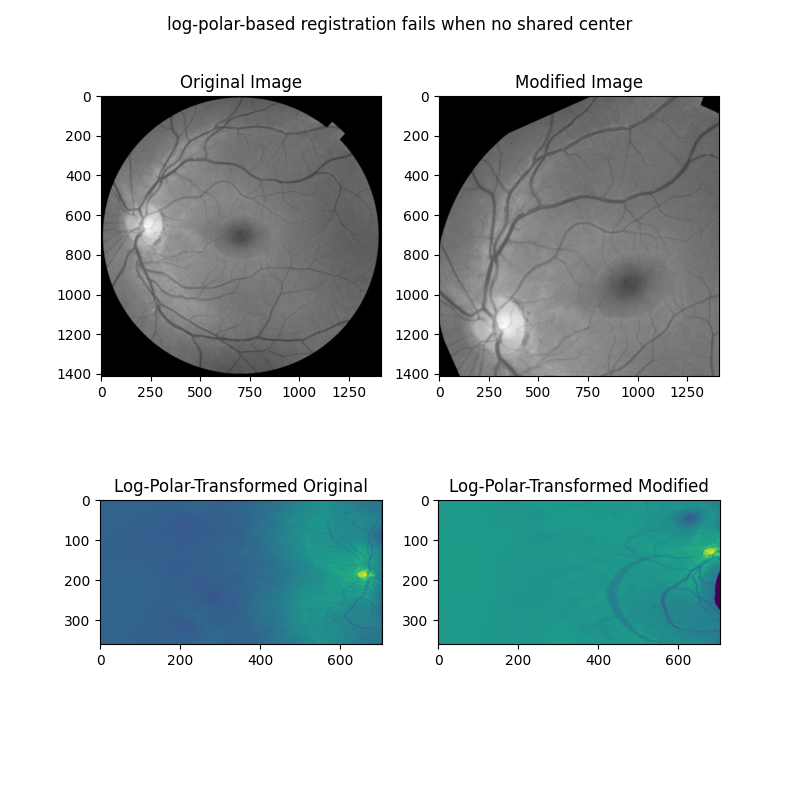
以上示例仅在要配准的图像共享中心时才有效。但是,更常见的情况是,两个要配准的图像之间的差异还存在平移分量。注册旋转、缩放和平移的一种方法是首先校正旋转和缩放,然后求解平移。通过处理傅里叶变换图像的幅度谱,可以解决平移图像的旋转和缩放差异。
在下一个示例中,我们首先展示当两个图像在旋转、缩放和平移方面不同时,上述方法如何失败。
from skimage.color import rgb2gray
from skimage.filters import window, difference_of_gaussians
from scipy.fft import fft2, fftshift

angle = 24
scale = 1.4
shiftr = 30
shiftc = 15

image = rgb2gray(data.retina())
translated = image[shiftr:, shiftc:]
rotated = rotate(translated, angle)
rescaled = rescale(rotated, scale)
sizer, sizec = image.shape
rts_image = rescaled[:sizer, :sizec]

# When center is not shared, log-polar transform is not helpful!
radius = 705
warped_image = warp_polar(image, radius=radius, scaling="log")
warped_rts = warp_polar(rts_image, radius=radius, scaling="log")
shifts, error, phasediff = phase_cross_correlation(
    warped_image, warped_rts, upsample_factor=20, normalization=None
)
shiftr, shiftc = shifts[:2]
klog = radius / np.log(radius)
shift_scale = 1 / (np.exp(shiftc / klog))

fig, axes = plt.subplots(2, 2, figsize=(8, 8))
ax = axes.ravel()
ax[0].set_title("Original Image")
ax[0].imshow(image, cmap='gray')
ax[1].set_title("Modified Image")
ax[1].imshow(rts_image, cmap='gray')
ax[2].set_title("Log-Polar-Transformed Original")
ax[2].imshow(warped_image)
ax[3].set_title("Log-Polar-Transformed Modified")
ax[3].imshow(warped_rts)
fig.suptitle('log-polar-based registration fails when no shared center')
plt.show()

print(f'Expected value for cc rotation in degrees: {angle}')
print(f'Recovered value for cc rotation: {shiftr}')
print()
print(f'Expected value for scaling difference: {scale}')
print(f'Recovered value for scaling difference: {shift_scale}')

Expected value for cc rotation in degrees: 24
Recovered value for cc rotation: -167.55

Expected value for scaling difference: 1.4
Recovered value for scaling difference: 25.110458986143573
在平移图像上注册旋转和缩放 - 第 2 部分#
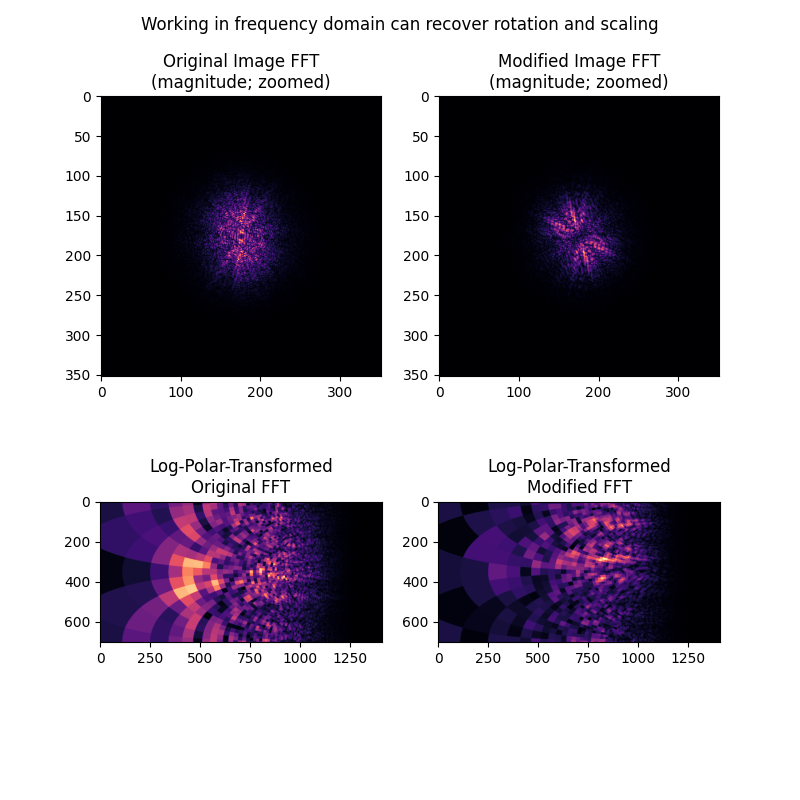
接下来,我们展示了旋转和缩放差异(但不是平移差异)如何在图像的频率幅度谱中显现出来。通过将幅度谱本身视为图像,并应用与上述相同的对数极坐标+相位相关方法,可以恢复这些差异。
# First, band-pass filter both images
image = difference_of_gaussians(image, 5, 20)
rts_image = difference_of_gaussians(rts_image, 5, 20)

# window images
wimage = image * window('hann', image.shape)
rts_wimage = rts_image * window('hann', image.shape)

# work with shifted FFT magnitudes
image_fs = np.abs(fftshift(fft2(wimage)))
rts_fs = np.abs(fftshift(fft2(rts_wimage)))

# Create log-polar transformed FFT mag images and register
shape = image_fs.shape
radius = shape[0] // 8  # only take lower frequencies
warped_image_fs = warp_polar(
    image_fs, radius=radius, output_shape=shape, scaling='log', order=0
)
warped_rts_fs = warp_polar(
    rts_fs, radius=radius, output_shape=shape, scaling='log', order=0
)

warped_image_fs = warped_image_fs[: shape[0] // 2, :]  # only use half of FFT
warped_rts_fs = warped_rts_fs[: shape[0] // 2, :]
shifts, error, phasediff = phase_cross_correlation(
    warped_image_fs, warped_rts_fs, upsample_factor=10, normalization=None
)

# Use translation parameters to calculate rotation and scaling parameters
shiftr, shiftc = shifts[:2]
recovered_angle = (360 / shape[0]) * shiftr
klog = shape[1] / np.log(radius)
shift_scale = np.exp(shiftc / klog)

fig, axes = plt.subplots(2, 2, figsize=(8, 8))
ax = axes.ravel()
ax[0].set_title("Original Image FFT\n(magnitude; zoomed)")
center = np.array(shape) // 2
ax[0].imshow(
    image_fs[
        center[0] - radius : center[0] + radius, center[1] - radius : center[1] + radius
    ],
    cmap='magma',
)
ax[1].set_title("Modified Image FFT\n(magnitude; zoomed)")
ax[1].imshow(
    rts_fs[
        center[0] - radius : center[0] + radius, center[1] - radius : center[1] + radius
    ],
    cmap='magma',
)
ax[2].set_title("Log-Polar-Transformed\nOriginal FFT")
ax[2].imshow(warped_image_fs, cmap='magma')
ax[3].set_title("Log-Polar-Transformed\nModified FFT")
ax[3].imshow(warped_rts_fs, cmap='magma')
fig.suptitle('Working in frequency domain can recover rotation and scaling')
plt.show()

print(f'Expected value for cc rotation in degrees: {angle}')
print(f'Recovered value for cc rotation: {recovered_angle}')
print()
print(f'Expected value for scaling difference: {scale}')
print(f'Recovered value for scaling difference: {shift_scale}')

Expected value for cc rotation in degrees: 24
Recovered value for cc rotation: 23.753366406803682

Expected value for scaling difference: 1.4
Recovered value for scaling difference: 1.3901762721757436
关于此方法的一些注意事项#
应该注意的是,这种方法依赖于几个必须提前选择的参数,并且没有明确的最佳选择
1. 应该对图像应用某种程度的带通滤波,特别是去除高频,并且此处的不同选择可能会影响结果。带通滤波器也使事情变得复杂,因为由于要配准的图像的比例不同,并且这些比例差异是未知的,因此任何带通滤波器都必然会衰减图像之间不同的特征。例如,在此处的最后一个示例中,对数极坐标变换的幅度谱看起来并不真正“相似”。但是,如果您仔细观察,这些频谱中存在一些共同的模式,并且正如所演示的那样,它们最终通过相位相关很好地对齐。
2. 必须使用具有圆形对称性的窗口对图像进行窗口化,以消除来自图像边界的频谱泄漏。没有明确的最佳窗口选择。
最后,我们注意到比例的巨大变化会极大地改变幅度谱,特别是因为比例的巨大变化通常会伴随一些裁剪和信息内容丢失。文献建议保持在 1.8-2 倍的比例变化内 [1] [2]。这对于大多数生物成像应用来说是好的。
参考资料#
脚本总运行时间: (0 分钟 7.940 秒)
