注意
转到末尾下载完整的示例代码。或通过 Binder 在浏览器中运行此示例
估计 3D 显微图像中的各向异性#
在本教程中,我们将计算 3D 图像的结构张量。有关 3D 图像处理的总体介绍,请参阅 探索 3D 图像(细胞)。我们此处使用的数据是从通过共聚焦荧光显微镜获得的肾脏组织图像中采样的(在 kidney-tissue-fluorescence.tif 下的 [1] 中有更多详细信息)。
import matplotlib.pyplot as plt
import numpy as np
import plotly.express as px
import plotly.io
from skimage import data, feature
加载图像#
此生物医学图像可通过 scikit-image 的数据注册表获得。
data = data.kidney()
我们的 3D 多通道图像的形状和大小究竟是什么?
print(f'number of dimensions: {data.ndim}')
print(f'shape: {data.shape}')
print(f'dtype: {data.dtype}')
number of dimensions: 4
shape: (16, 512, 512, 3)
dtype: uint16
为了本教程的目的,我们将仅考虑第二个颜色通道,这使我们得到一个 3D 单通道图像。值的范围是多少?
range: (68, 4095)
让我们可视化我们的 3D 图像的中间切片。
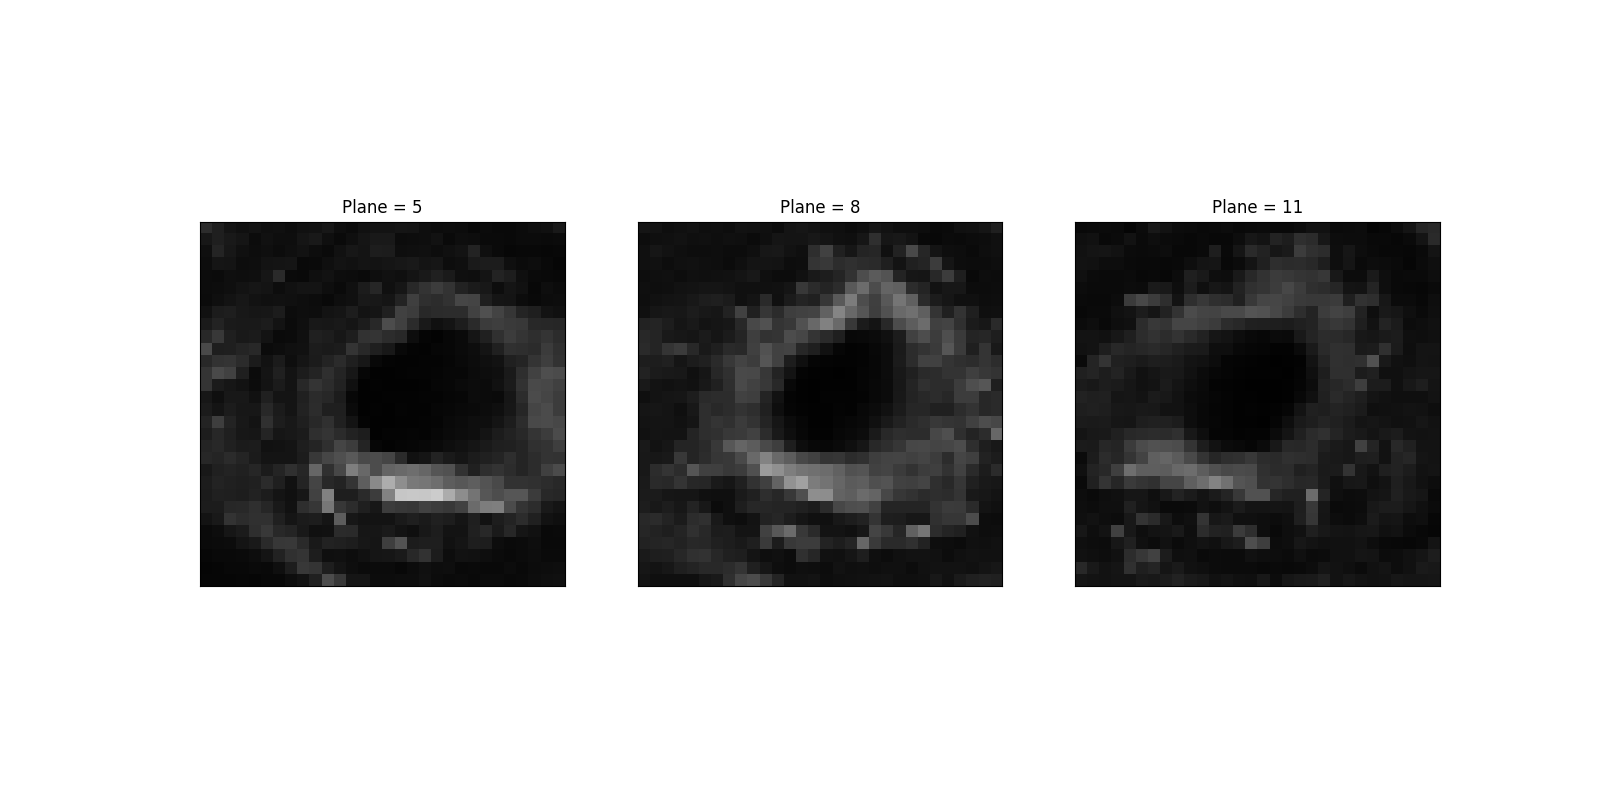
让我们选择一个显示相对 X-Y 各向同性的特定区域。相比之下,沿 Z 方向的梯度差异很大(而且就此而言,很弱)。
sample = data[5:13, 380:410, 370:400, 1]
step = 3
cols = sample.shape[0] // step + 1
_, axes = plt.subplots(nrows=1, ncols=cols, figsize=(16, 8))
for it, (ax, image) in enumerate(zip(axes.flatten(), sample[::step])):
ax.imshow(image, cmap='gray', vmin=v_min, vmax=v_max)
ax.set_title(f'Plane = {5 + it * step}')
ax.set_xticks([])
ax.set_yticks([])

要以 3D 方式查看示例数据,请运行以下代码
import plotly.graph_objects as go
(n_Z, n_Y, n_X) = sample.shape
Z, Y, X = np.mgrid[:n_Z, :n_Y, :n_X]
fig = go.Figure(
data=go.Volume(
x=X.flatten(),
y=Y.flatten(),
z=Z.flatten(),
value=sample.flatten(),
opacity=0.5,
slices_z=dict(show=True, locations=[4])
)
)
fig.show()
计算结构张量#
让我们可视化示例数据的底部切片,并确定强变化的典型大小。我们将使用此大小作为窗口函数的“宽度”。
在最亮区域(即,在第 22 行和第 17 列附近),我们可以看到跨列(分别为行)2 或 3 个(分别为 1 或 2 个)像素的变化(因此,是强梯度)。因此,我们可以为窗口函数选择,例如,sigma = 1.5。或者,我们可以按每个轴传递 sigma,例如,sigma = (1, 2, 3)。请注意,大小 1 在第一个(Z,平面)轴上听起来是合理的,因为后者的大小为 8 (13 - 5)。在 X-Z 或 Y-Z 平面中查看切片可以证实这是合理的。
然后,我们可以计算结构张量的特征值。
(3, 8, 30, 30)
最大特征值在哪里?
coords = np.unravel_index(eigen.argmax(), eigen.shape)
assert coords[0] == 0 # by definition
coords
(np.int64(0), np.int64(1), np.int64(22), np.int64(16))
注意
读者可以检查此结果(坐标 (plane, row, column) = coords[1:])在 sigma 变化时有多么稳健。
让我们查看在找到最大特征值的 X-Y 平面中特征值的空间分布(即,Z = coords[1])。
