注意
转到末尾以下载完整的示例代码。或通过 Binder 在浏览器中运行此示例
熵#
在信息论中,信息熵是消息可能结果数量的以 2 为底的对数。
对于图像,局部熵与给定邻域中包含的复杂性有关,通常由结构元素定义。熵滤波器可以检测局部灰度分布中的细微变化。
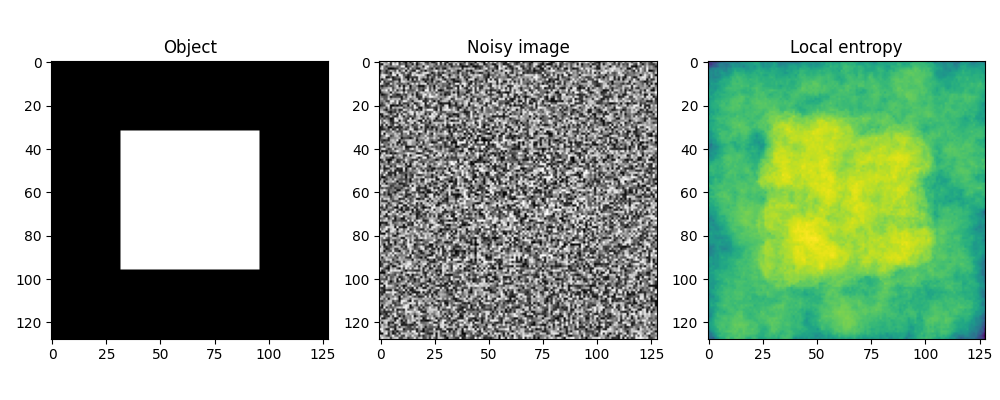
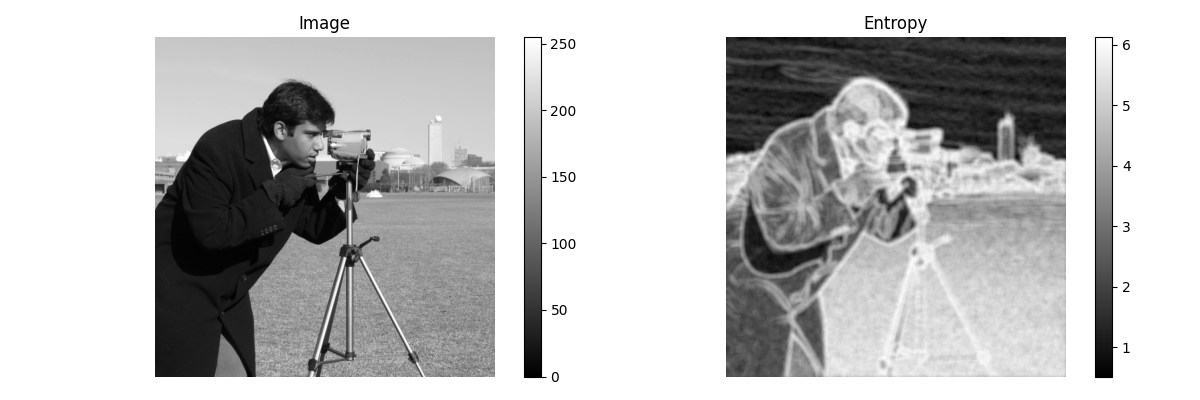
在第一个示例中,图像由两个表面组成,这两个表面具有略微不同的分布。图像在图像中间具有范围为 [-15, +15] 的均匀随机分布,在图像边界处具有范围为 [-14, 14] 的均匀随机分布,均以 128 的灰度值居中。要检测中心正方形,我们使用足够大的圆形结构元素来计算局部熵度量,以捕获局部灰度分布。第二个示例展示了如何使用较小的结构元素检测相机图像中的纹理。
对象检测#
import matplotlib.pyplot as plt
import numpy as np

from skimage import data
from skimage.util import img_as_ubyte
from skimage.filters.rank import entropy
from skimage.morphology import disk

rng = np.random.default_rng()

noise_mask = np.full((128, 128), 28, dtype=np.uint8)
noise_mask[32:-32, 32:-32] = 30

noise = (noise_mask * rng.random(noise_mask.shape) - 0.5 * noise_mask).astype(np.uint8)
img = noise + 128

entr_img = entropy(img, disk(10))

fig, (ax0, ax1, ax2) = plt.subplots(nrows=1, ncols=3, figsize=(10, 4))

img0 = ax0.imshow(noise_mask, cmap='gray')
ax0.set_title("Object")
ax1.imshow(img, cmap='gray')
ax1.set_title("Noisy image")
ax2.imshow(entr_img, cmap='viridis')
ax2.set_title("Local entropy")

fig.tight_layout()

纹理检测#
image = img_as_ubyte(data.camera())

fig, (ax0, ax1) = plt.subplots(ncols=2, figsize=(12, 4), sharex=True, sharey=True)

img0 = ax0.imshow(image, cmap=plt.cm.gray)
ax0.set_title("Image")
ax0.axis("off")
fig.colorbar(img0, ax=ax0)

img1 = ax1.imshow(entropy(image, disk(5)), cmap='gray')
ax1.set_title("Entropy")
ax1.axis("off")
fig.colorbar(img1, ax=ax1)

fig.tight_layout()

plt.show()

脚本的总运行时间:(0 分钟 1.577 秒)
