注意
转到末尾下载完整的示例代码。或通过 Binder 在浏览器中运行此示例
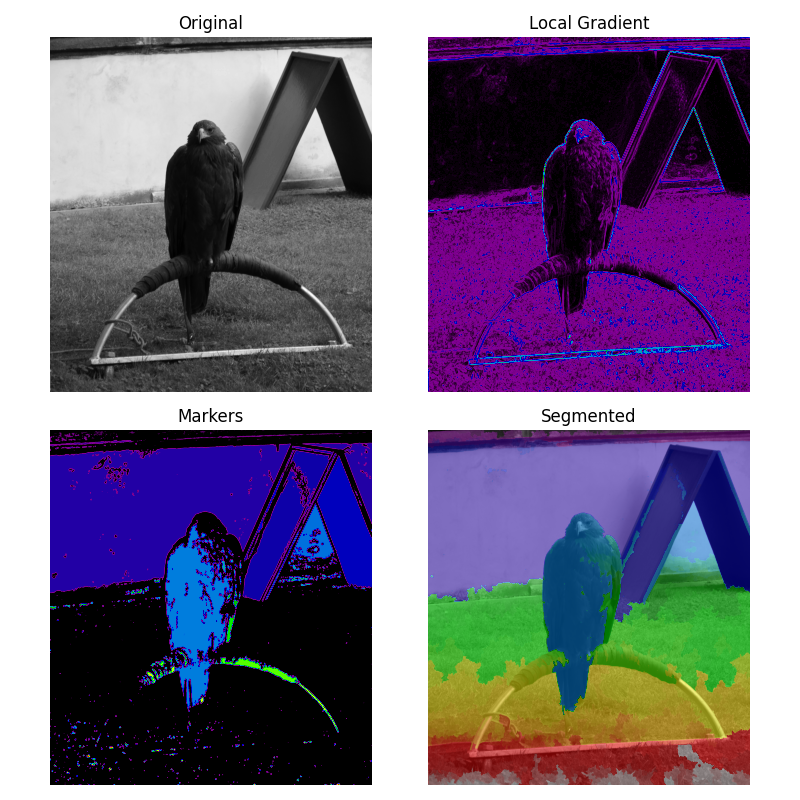
分水岭变换的标记#
分水岭是一种用于分割的经典算法,即用于分离图像中不同的对象。
这里,标记图像是通过图像内低梯度区域构建的。在梯度图像中,高值区域提供有助于分割图像的屏障。在较低值上使用标记将确保找到分割的对象。
有关该算法的更多详细信息,请参见 维基百科。
from scipy import ndimage as ndi
import matplotlib.pyplot as plt

from skimage.morphology import disk
from skimage.segmentation import watershed
from skimage import data
from skimage.filters import rank
from skimage.util import img_as_ubyte


image = img_as_ubyte(data.eagle())

# denoise image
denoised = rank.median(image, disk(2))

# find continuous region (low gradient -
# where less than 10 for this image) --> markers
# disk(5) is used here to get a more smooth image
markers = rank.gradient(denoised, disk(5)) < 10
markers = ndi.label(markers)[0]

# local gradient (disk(2) is used to keep edges thin)
gradient = rank.gradient(denoised, disk(2))

# process the watershed
labels = watershed(gradient, markers)

# display results
fig, axes = plt.subplots(nrows=2, ncols=2, figsize=(8, 8), sharex=True, sharey=True)
ax = axes.ravel()

ax[0].imshow(image, cmap=plt.cm.gray)
ax[0].set_title("Original")

ax[1].imshow(gradient, cmap=plt.cm.nipy_spectral)
ax[1].set_title("Local Gradient")

ax[2].imshow(markers, cmap=plt.cm.nipy_spectral)
ax[2].set_title("Markers")

ax[3].imshow(image, cmap=plt.cm.gray)
ax[3].imshow(labels, cmap=plt.cm.nipy_spectral, alpha=0.5)
ax[3].set_title("Segmented")

for a in ax:
    a.axis('off')

fig.tight_layout()
plt.show()
脚本的总运行时间:(0 分钟 6.628 秒)