注意
转到末尾下载完整示例代码。或通过 Binder 在浏览器中运行此示例
随机游走分割#
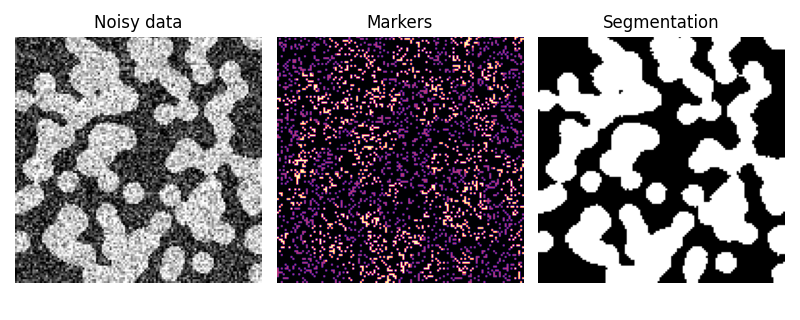
随机游走算法 [1] 通过一组标记几个相(2 个或更多)的标记来确定图像的分割。求解各向异性扩散方程,其中示踪剂在标记位置启动。如果相邻像素具有相似的值,则局部扩散系数会更大,因此扩散很难跨越高梯度。每个未知像素的标签归因于在此扩散过程中最有可能首先到达的已知标记的标签。
在此示例中,可以清楚地看到两个阶段,但是数据噪声太大,无法仅从直方图执行分割。我们从灰度值的直方图的极端尾部确定两个阶段的标记,并使用随机游走进行分割。

import numpy as np
import matplotlib.pyplot as plt

from skimage.segmentation import random_walker
from skimage.data import binary_blobs
from skimage.exposure import rescale_intensity
import skimage

rng = np.random.default_rng()

# Generate noisy synthetic data
data = skimage.img_as_float(binary_blobs(length=128, rng=1))
sigma = 0.35
data += rng.normal(loc=0, scale=sigma, size=data.shape)
data = rescale_intensity(data, in_range=(-sigma, 1 + sigma), out_range=(-1, 1))

# The range of the binary image spans over (-1, 1).
# We choose the hottest and the coldest pixels as markers.
markers = np.zeros(data.shape, dtype=np.uint)
markers[data < -0.95] = 1
markers[data > 0.95] = 2

# Run random walker algorithm
labels = random_walker(data, markers, beta=10, mode='bf')

# Plot results
fig, (ax1, ax2, ax3) = plt.subplots(1, 3, figsize=(8, 3.2), sharex=True, sharey=True)
ax1.imshow(data, cmap='gray')
ax1.axis('off')
ax1.set_title('Noisy data')
ax2.imshow(markers, cmap='magma')
ax2.axis('off')
ax2.set_title('Markers')
ax3.imshow(labels, cmap='gray')
ax3.axis('off')
ax3.set_title('Segmentation')

fig.tight_layout()
plt.show()
脚本的总运行时间:(0 分钟 0.559 秒)
