注意
转到末尾以下载完整的示例代码。或者通过 Binder 在浏览器中运行此示例
使用简单的图像拼接组装图像#
此示例演示如何在刚体运动的假设下组装一组图像。
from matplotlib import pyplot as plt
import numpy as np
from skimage import data, util, transform, feature, measure, filters, metrics


def match_locations(img0, img1, coords0, coords1, radius=5, sigma=3):
    """Match image locations using SSD minimization.

    Areas from `img0` are matched with areas from `img1`. These areas
    are defined as patches located around pixels with Gaussian
    weights.

    Parameters
    ----------
    img0, img1 : 2D array
        Input images.
    coords0 : (2, m) array_like
        Centers of the reference patches in `img0`.
    coords1 : (2, n) array_like
        Centers of the candidate patches in `img1`.
    radius : int
        Radius of the considered patches.
    sigma : float
        Standard deviation of the Gaussian kernel centered over the patches.

    Returns
    -------
    match_coords: (2, m) array
        The points in `coords1` that are the closest corresponding matches to
        those in `coords0` as determined by the (Gaussian weighted) sum of
        squared differences between patches surrounding each point.
    """
    y, x = np.mgrid[-radius : radius + 1, -radius : radius + 1]
    weights = np.exp(-0.5 * (x**2 + y**2) / sigma**2)
    weights /= 2 * np.pi * sigma * sigma

    match_list = []
    for r0, c0 in coords0:
        roi0 = img0[r0 - radius : r0 + radius + 1, c0 - radius : c0 + radius + 1]
        roi1_list = [
            img1[r1 - radius : r1 + radius + 1, c1 - radius : c1 + radius + 1]
            for r1, c1 in coords1
        ]
        # sum of squared differences
        ssd_list = [np.sum(weights * (roi0 - roi1) ** 2) for roi1 in roi1_list]
        match_list.append(coords1[np.argmin(ssd_list)])

    return np.array(match_list)
数据生成#
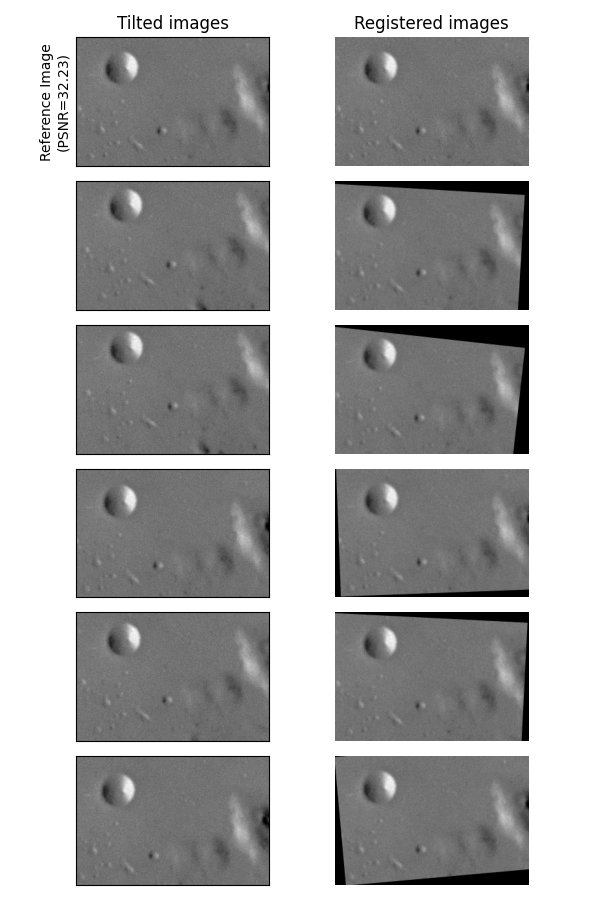
在此示例中,我们生成一个包含稍微倾斜的噪声图像的列表。
img = data.moon()

angle_list = [0, 5, 6, -2, 3, -4]
center_list = [(0, 0), (10, 10), (5, 12), (11, 21), (21, 17), (43, 15)]

img_list = [
    transform.rotate(img, angle=a, center=c)[40:240, 50:350]
    for a, c in zip(angle_list, center_list)
]
ref_img = img_list[0].copy()

img_list = [
    util.random_noise(filters.gaussian(im, sigma=1.1), var=5e-4, rng=seed)
    for seed, im in enumerate(img_list)
]

psnr_ref = metrics.peak_signal_noise_ratio(ref_img, img_list[0])
图像配准#
注意
此步骤使用 使用 RANSAC 进行鲁棒匹配 中描述的方法执行,但根据您的问题,可以应用 图像配准 部分中的任何其他方法。
参考点是在列表中的所有图像上检测到的。
min_dist = 5
corner_list = [
    feature.corner_peaks(
        feature.corner_harris(img), threshold_rel=0.001, min_distance=min_dist
    )
    for img in img_list
]
在第一张图像中检测到的哈里斯角被选为参考。然后,将其他图像上检测到的点与参考点匹配。
img0 = img_list[0]
coords0 = corner_list[0]
matching_corners = [
    match_locations(img0, img1, coords0, coords1, min_dist)
    for img1, coords1 in zip(img_list, corner_list)
]
一旦所有点都注册到参考点,就可以使用 RANSAC 方法估计鲁棒的相对仿射变换。
src = np.array(coords0)
trfm_list = [
    measure.ransac(
        (dst, src),
        transform.EuclideanTransform,
        min_samples=3,
        residual_threshold=2,
        max_trials=100,
    )[0].params
    for dst in matching_corners
]

fig, ax_list = plt.subplots(6, 2, figsize=(6, 9), sharex=True, sharey=True)
for idx, (im, trfm, (ax0, ax1)) in enumerate(zip(img_list, trfm_list, ax_list)):
    ax0.imshow(im, cmap="gray", vmin=0, vmax=1)
    ax1.imshow(transform.warp(im, trfm), cmap="gray", vmin=0, vmax=1)

    if idx == 0:
        ax0.set_title("Tilted images")
        ax0.set_ylabel(f"Reference Image\n(PSNR={psnr_ref:.2f})")
        ax1.set_title("Registered images")

    ax0.set(xticklabels=[], yticklabels=[], xticks=[], yticks=[])
    ax1.set_axis_off()

fig.tight_layout()

图像组装#
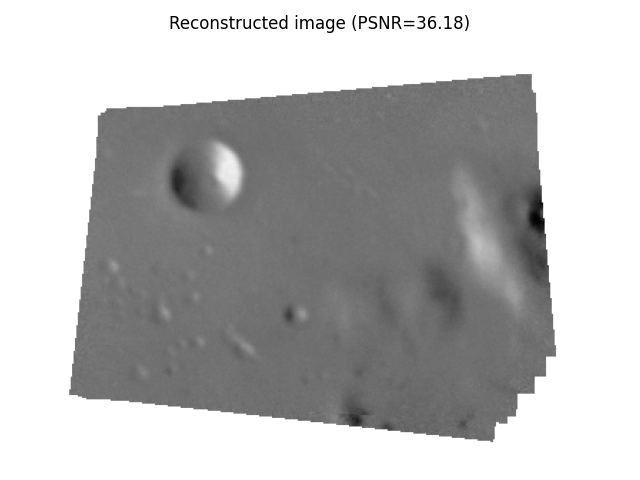
可以使用相对于参考图像的已注册图像的位置来获得合成图像。为此,我们在参考图像周围定义一个全局域,并将其他图像定位在此域中。
定义全局变换以通过简单的平移将参考图像移动到全局域图像中
最后,通过将全局变换与相对变换合成,可以获得其他图像在全局域中的相对位置
global_img_list = [
    transform.warp(
        img, trfm.dot(glob_trfm), output_shape=out_shape, mode="constant", cval=np.nan
    )
    for img, trfm in zip(img_list, trfm_list)
]

all_nan_mask = np.all([np.isnan(img) for img in global_img_list], axis=0)
global_img_list[0][all_nan_mask] = 1.0

composite_img = np.nanmean(global_img_list, 0)
psnr_composite = metrics.peak_signal_noise_ratio(
    ref_img, composite_img[margin : margin + height, margin : margin + width]
)

fig, ax = plt.subplots(1, 1)

ax.imshow(composite_img, cmap="gray", vmin=0, vmax=1)
ax.set_axis_off()
ax.set_title(f"Reconstructed image (PSNR={psnr_composite:.2f})")
fig.tight_layout()

plt.show()

脚本的总运行时间:(0 分 1.527 秒)
