注意
转到结尾下载完整的示例代码。或通过 Binder 在浏览器中运行此示例
形状索引#
形状索引是对局部曲率的单值度量,它源自 Hessian 矩阵的特征值,由 Koenderink & van Doorn 定义 [1]。
它可以用于根据结构的局部形状来查找结构。
形状索引映射到 -1 到 1 的值,代表不同类型的形状(有关详细信息,请参阅文档)。
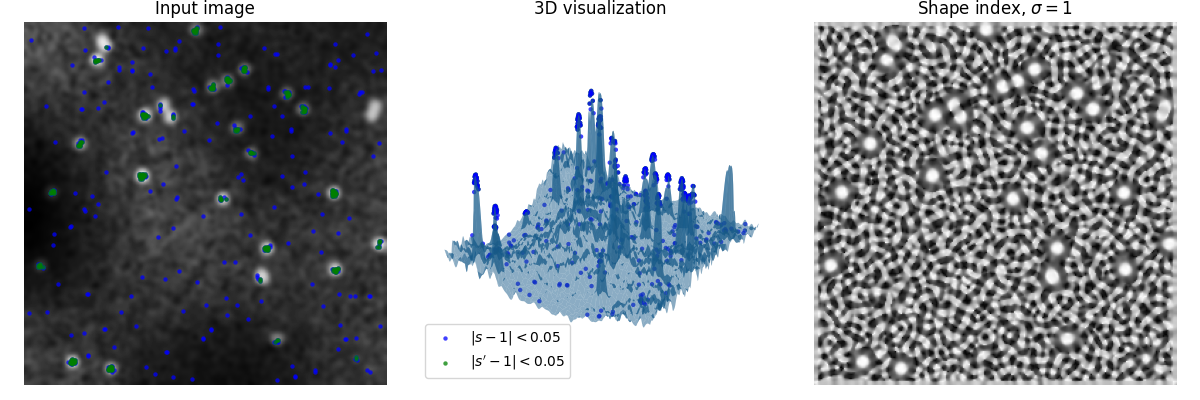
在此示例中,生成一个带有斑点的随机图像,应该检测到这些斑点。
形状索引 1 表示“球形帽”,这是我们想要检测的斑点的形状。
最左边的图显示生成的图像,中间显示图像的 3D 渲染,将强度值作为 3D 曲面的高度,右边的图显示形状索引 (s)。
可见,形状索引很容易放大噪声的局部形状,但对全局现象(例如,不均匀的照明)不敏感。
蓝色和绿色标记是与所需形状偏差不超过 0.05 的点。为了减弱信号中的噪声,绿色标记取自另一个高斯模糊处理后的形状索引 (s)(产生 s’)。
请注意,彼此过于靠近的斑点不会被检测到,因为它们不具备所需的形状。

import numpy as np
import matplotlib.pyplot as plt
from scipy import ndimage as ndi
from skimage.feature import shape_index
from skimage.draw import disk


def create_test_image(image_size=256, spot_count=30, spot_radius=5, cloud_noise_size=4):
    """
    Generate a test image with random noise, uneven illumination and spots.
    """
    rng = np.random.default_rng()
    image = rng.normal(loc=0.25, scale=0.25, size=(image_size, image_size))

    for _ in range(spot_count):
        rr, cc = disk(
            (rng.integers(image.shape[0]), rng.integers(image.shape[1])),
            spot_radius,
            shape=image.shape,
        )
        image[rr, cc] = 1

    image *= rng.normal(loc=1.0, scale=0.1, size=image.shape)

    image *= ndi.zoom(
        rng.normal(loc=1.0, scale=0.5, size=(cloud_noise_size, cloud_noise_size)),
        image_size / cloud_noise_size,
    )

    return ndi.gaussian_filter(image, sigma=2.0)


# First create the test image and its shape index

image = create_test_image()

s = shape_index(image)

# In this example we want to detect 'spherical caps',
# so we threshold the shape index map to
# find points which are 'spherical caps' (~1)

target = 1
delta = 0.05

point_y, point_x = np.where(np.abs(s - target) < delta)
point_z = image[point_y, point_x]

# The shape index map relentlessly produces the shape, even that of noise.
# In order to reduce the impact of noise, we apply a Gaussian filter to it,
# and show the results once in

s_smooth = ndi.gaussian_filter(s, sigma=0.5)

point_y_s, point_x_s = np.where(np.abs(s_smooth - target) < delta)
point_z_s = image[point_y_s, point_x_s]


fig = plt.figure(figsize=(12, 4))
ax1 = fig.add_subplot(1, 3, 1)

ax1.imshow(image, cmap=plt.cm.gray)
ax1.axis('off')
ax1.set_title('Input image')

scatter_settings = dict(alpha=0.75, s=10, linewidths=0)

ax1.scatter(point_x, point_y, color='blue', **scatter_settings)
ax1.scatter(point_x_s, point_y_s, color='green', **scatter_settings)

ax2 = fig.add_subplot(1, 3, 2, projection='3d', sharex=ax1, sharey=ax1)

x, y = np.meshgrid(np.arange(0, image.shape[0], 1), np.arange(0, image.shape[1], 1))

ax2.plot_surface(x, y, image, linewidth=0, alpha=0.5)

ax2.scatter(
    point_x, point_y, point_z, color='blue', label='$|s - 1|<0.05$', **scatter_settings
)

ax2.scatter(
    point_x_s,
    point_y_s,
    point_z_s,
    color='green',
    label='$|s\' - 1|<0.05$',
    **scatter_settings,
)

ax2.legend(loc='lower left')

ax2.axis('off')
ax2.set_title('3D visualization')

ax3 = fig.add_subplot(1, 3, 3, sharex=ax1, sharey=ax1)

ax3.imshow(s, cmap=plt.cm.gray)
ax3.axis('off')
ax3.set_title(r'Shape index, $\sigma=1$')

fig.tight_layout()

plt.show()
脚本的总运行时间:(0 分钟 1.457 秒)
